Optimizing the WinDbg DML parser
One of my pet project is writing a custom command window for WinDbg. When testing that custom command window with big outputs, I quickly noticed that the performance was unacceptable: the first few lines would be displayed smoothly, then the application would become slower and slower until almost freezing. I therefore decided to optimize my implementation: tweaking the rendering code, batching updates, … But no matter what I did, the performance was still bad. Worse still: there was no noticeable improvement at all.
That’s when I realized I broke the three first rules of optimization: measure, measure, and measure some more. So I fired up JetBrains dotTrace and started profiling the application.
 WinDbg profile when executing a large command
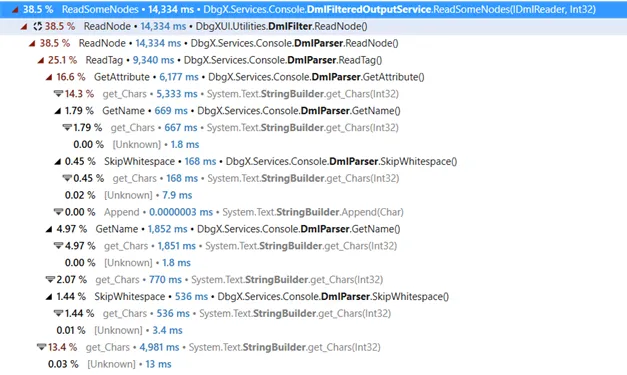
As is often the case, the bottleneck wasn’t where I was searching. In fact, it wasn’t in my code at all. WinDbg is supporting hypertext through a syntax called Debugger Markup Language (aka DML): this is how you get nice clickable links. And it seemed that WinDbg’s DML parser was the biggest hotspot by far, even though I wasn’t actually using it. In fact, the same performance issue occurred with the native command window.
Digging deeper, it seemed that a whopping 99.8% of the CPU time in the DML parser was spent… In StringBuilder.get_Chars:

What can the DML parser possibly do to cause this? Let’s dig into it.
StringBuilder char accessor
Looking at the code with a decompiler, I could reconstruct how WinDbg processes the output of the commands:
-
Whenever the debugging engine outputs something, append it to a buffer (a
StringBuilder) -
In the background, run a loop that parses a few nodes from the buffer (DML looks a lot like HTML), refreshes the UI, parses a few more nodes, and so on
-
If at some point there are no more nodes in the buffer, clear it
The important part to understand is that the parsing loop maintains an index indicating how much of the buffer it had parsed, but clears the buffer only when it is fully processed.
The parsing code itself is straightforward, iterating character by character to detect the beginning and the end of the nodes and creating the corresponding data structures. Individual characters are accessed using the StringBuilder indexer, which appears as StringBuilder.get_Chars in the profiler trace.
But how many times does the DML parser uses the indexer to consume that much CPU? The answer is… less than you would think.
Using the indexer of a string to get an individual char is an O(1) operation. As a string is really just a fancy array of chars, you only need some bound checking before fetching the value. Intuitively, one would expect a similar behavior from a StringBuilder. However, the benchmarks tell a whole different story:
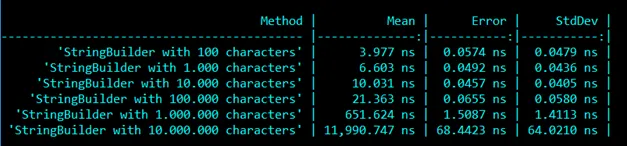
This benchmark measures the time needed to access the first character of StringBuilder instances of different sizes. At a glance, it’s pretty obvious that the access time degrades non-linearly with the number of characters. So what’s going on under the hood?
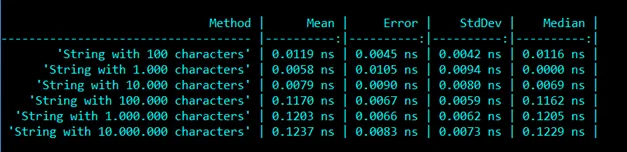
For reference, here is the same benchmark using a String indexer instead:
StringBuilder is a class that pre-allocates an array of that you can use to concatenate a variable number of strings while limiting the number of allocations. In that sense, it works a lot like List<char>. However, since .NET 4.0, the way it grows when reaching the limit as changed: instead of allocating a bigger array and transferring the contents of the previous array, like List<T> would do, it allocates a new StringBuilder and chains to it. This has a double benefit: when dealing with very large string, it avoids copying large buffers, which would be costly, and keeps the size of individual buffers in check so they don’t end up in the LOH. So in the end, you can think of the StringBuilder as a linked list of char arrays.
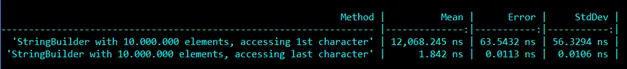
It also comes with some drawbacks, as the benchmark puts in evidence. To retrieve a specific character, you need to browse the chain of StringBuilder instances until finding the one containing the character at the right index. It means that getting a character at a given index is actually an O(n) operation, where n is the number of chained instances. And it gets worse: the most commonly used operation with a StringBuilder is Append, which appends a string to the end of the buffer. Keeping that in mind, the StringBuilders are chained from the end: your StringBuilder reference points to the last of the chain, and each of them holds a reference to the previous one. This makes Append operations faster, since you don’t have to browse the whole chain to append your characters. But on the other hand, it makes accessing the beginning of the string much more expensive, since the whole chain has to be browsed. See in this benchmark how much it costs to access the first character versus accessing the last, with a StringBuilder of 10 million characters:
 WinDbg profile when executing a large command
Now that we know how StringBuilder works, we understand what’s happening in WinDbg. On one side, a command is executed and the output is pushed to a StringBuilder. On the other side, the contents of the StringBuilder is parsed and the result is displayed on the screen. If at some point new content is added faster than it is parsed, we enter a vicious cycle: because the current index is getting farther away from the end of the StringBuilder, accessing individual characters takes more and more time and slows down the parsing. Because the parsing is slowed down, the current index is getting father away from the end of the StringBuilder as new content is pushed to it. At some point, it becomes so expensive that almost no parsing is done, and the application freezes.
Using the right tool for the right job
How can we fix that? The StringBuilder was a poor choice for this usage. Every time content is appended to the buffer, we make a copy of the string for no reason, and we’ve seen that the performance profile to access individual characters is not adapted for the task. Instead, the DML parser could use a simple queue of strings. It would also need a trim function to remove the strings from the queue as they are processed. I ended up submitting the following implementation:
public class StringBuffer
{
    private Queue<string> _buffer = new Queue<string>();

    private int _offset;

    public int Length;

    public void Append(string content)
    {
        _buffer.Enqueue(content);
        Length += content.Length;
    }

    public char this[int index]
    {
        get
        {
            var i = index - _offset;

            foreach (var element in _buffer)
            {
                if (i >= element.Length)
                {
                    i -= element.Length;
                    continue;
                }

                return element[i];
            }

            throw new IndexOutOfRangeException();
        }
    }

    public void Clear()
    {
        _buffer.Clear();
        Length = 0;
        _offset = 0;
    }

    public void Trim(int index)
    {
        index = index - _offset - 1;

        while (index > 0)
        {
            var str = _buffer.Peek();

            index -= str.Length;

            if (index > 0)
            {
                _offset += str.Length;
                _buffer.Dequeue();
            }
        }
    }
}
As much as possible, it sticks to the StringBuilder API to avoid having to modify the parsing code. The Trim method is called whenever the parser has finished reading a node, with the index of the last character processed. With that solution, we avoid the string copy to the StringBuilder, and accessing individual characters stays an O(1) operation most of the time.
And the performance improvement is very apparent when tested live (old version on the left, new version on the right)
}}The fix has since then been released in the official version. I’d like to thank Microsoft for their openness in accepting outside contributions (though it would be even better if the whole project was open-source 🙂).