Reading .NET performance counters without the PerfCounter API
Note: The code was originally written as part of my job at Datadog and published on the dd-trace-dotnet repository under Apache 2.0 license.
The excerpts of code in this article are therefore licensed under the same terms. Before using them, quoting them, or redistributing them, make sure to check the terms of the license and the notice.
The Datadog .NET tracer has a feature named “runtime metrics”. It collects technical metrics about the way your application behaves and publishes them to a dedicated dashboard, that you can use to diagnose your performance issues:
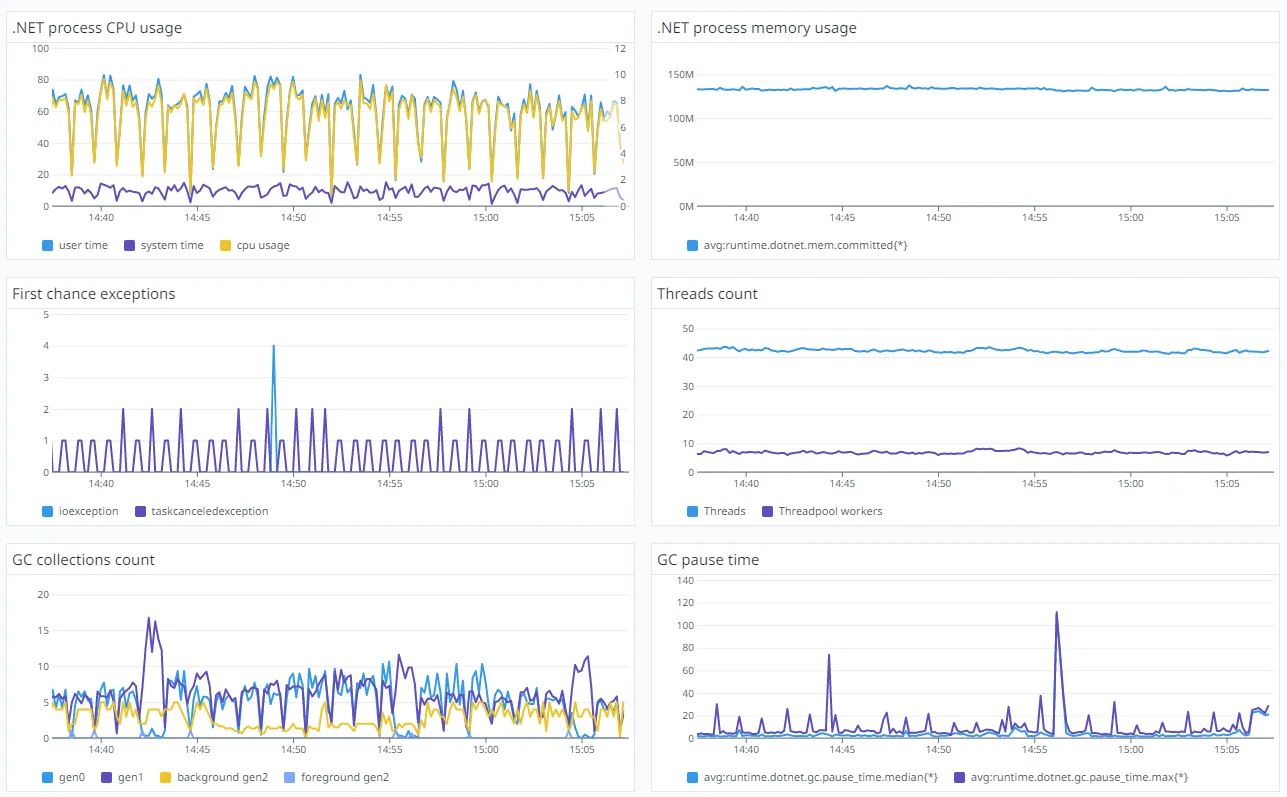
Many of those metrics are gathered from the CLR, using performance counters on .NET Framework and event counters on .NET Core.
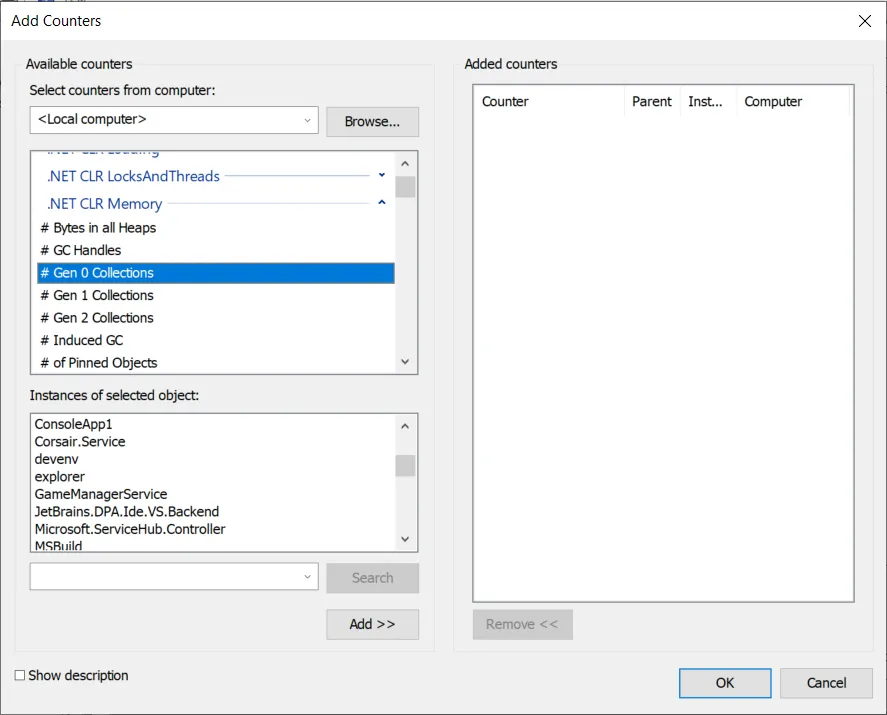
Reading a performance counter in .NET is fairly straightforward, and the code looks like:
var counter = new PerformanceCounter(".NET CLR Memory", "Gen 0 heap size", "ConsoleApp1");
Console.WriteLine(counter.NextValue());
This will load the “Gen 0 heap size” performance counter from the “.NET CLR Memory” category, and target the instance “ConsoleApp1” (for .NET performance counters, the instance is the name of the target process).
Performance counters can be dangerous
Because Datadog has a wide customer base, our library is deployed in a variety of environments, and occasionally we received reports of weird error messages in the event log when activating the runtime metrics on .NET Framework. That was not ideal but acceptable. However at some point one customer reported to us that their application crashed with an AccessViolationException.
To understand how that’s possible, we need to discuss how performance counters work. Every performance counter has a provider associated to it, which is responsible for publishing the value.
Be aware that there are two types of providers: v1 and v2. I will not cover v2 counters as I have almost no knowledge on the subject, and .NET performance counters providers use v1.
With v1, every performance counter provider is registered in the registry. Among other things, the registration information contains the path to the DLL of the provider. To read a performance counter, you need to:
-
Find the performance counter provider information in the registry
-
Load the specified DLL
-
Call it to get the value
This came as a massive surprise to me. Loading an arbitrary DLL into your process comes with a significant reliability risk, especially when using a managed runtime such as .NET. I personally expected Windows to play the role of the middle-man to get the value of the counter, and from what I understand this is actually the case in version 2 of the API.
So can we conclude that the crash experienced by that one customer was caused by the DLL associated to the .NET performance counters providers?
Well it gets worse.
I described the steps to read a performance counter, but you’re not actually expected to follow them yourself. There are multiple APIs available to abstract all of this, like PDH, PerfLib, or… the registry. The HKEY_PERFORMANCE_DATA key in the registry is special, and when trying to read it, Windows will automatically return the value of the performance counters registered on your machine.
Which one of those APIs is used by .NET? When using the PerformanceCounter class to read performance counters, .NET relies on the registry to get the value of the performance counters you’re requesting.
And here comes the real problem. I don’t know if it’s a quirk of the registry API, or a side-effect of how .NET uses it, but reading a performance counter using the .NET PerformanceCounter class triggers the enumeration of all the performance counters registered on the machine. Put in other words, the first time you use PerformanceCounter, .NET will load every single performance provider registered on your machine, query metadata from it, and then unload it.
It means that we are not just loading the performance counter provider we are interested in, but also a bunch of other DLLs we know nothing about. In the case of the unfortunate customer, it means that one of the performance counters provider installed on their machine is garbage, and it corrupts the process memory when loading it.
From a purely technical standpoint, Datadog is not responsible for this crash. We are using a .NET API to query a well-known performance counter provider, and because of the way its implemented in .NET it causes another bogus provider to be loaded. We could probably have asked the customer to clean their machine and closed the case. But on the other hand, that third-party provider probably wouldn’t have been loaded if we hadn’t tried to read performance counters, and so we definitely played a role in the crash. To prevent any future occurrence, I decided to look for a safer way to read those counters.
Looking for an alternative
As I mentioned earlier, there are three ways to query performance counters: the registry, PDH, and PerfLib. PerfLib can only be used with v2 providers, so I decided to experiment with PDH. I wrote my own bogus performance counter provider and registered it on my machine, then I started writing a prototype using PDH to confirm that my DLL wasn’t getting loaded as a side-effect.
And that’s when it hit me.
I mentioned earlier that a performance counter has an instance associated to it. For performance counters provided by .NET, that instance is the name of the process you want to read counters from.
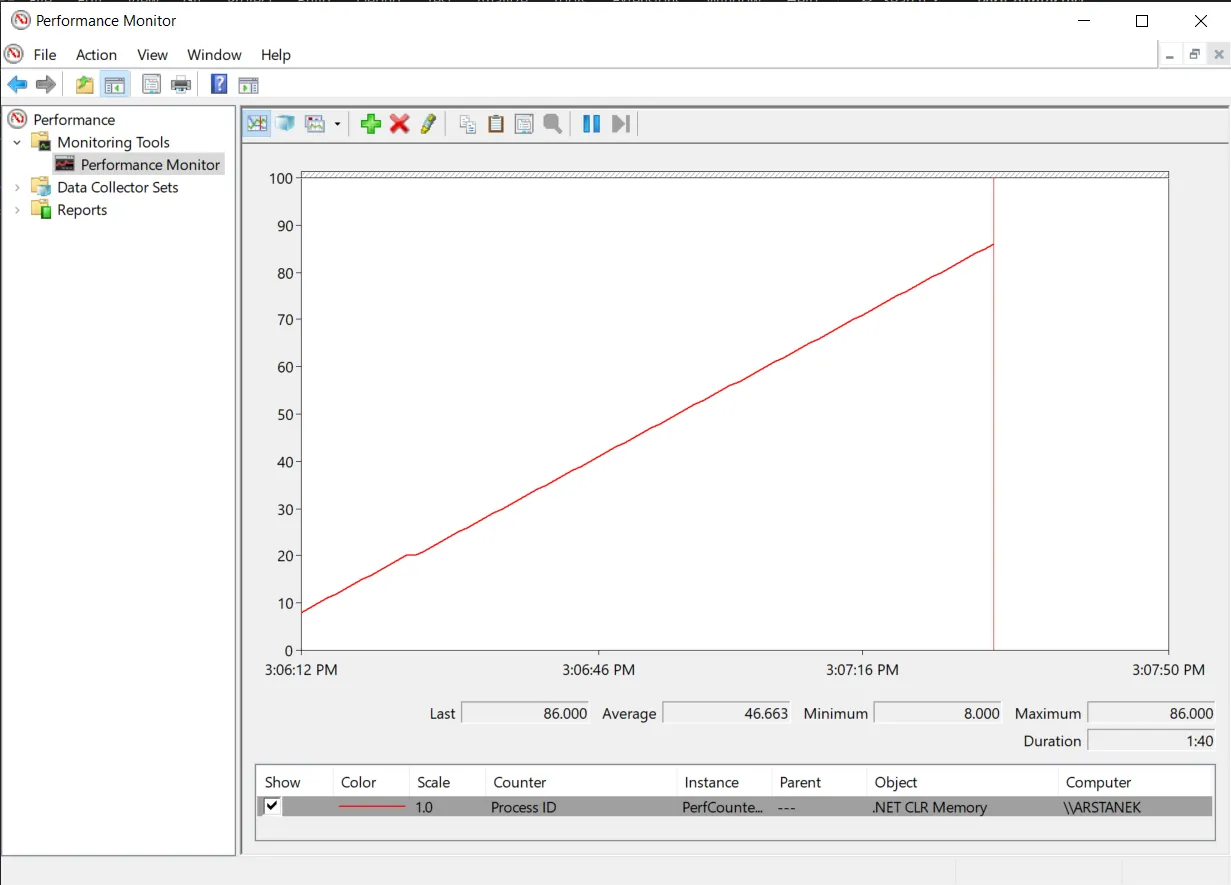
 See the instance name in the bottom-left panel
But as I’ve explained, to read the value of a performance counter, you load the provider (which is just a DLL) into your process and call it. So if I create a console application, say ConsoleApp1.exe, and I query the performance counters from another process, say devenv.exe, since the provider is loaded into ConsoleApp1.exe it means some kind of inter-process communication (IPC) mechanism is used to query the performance values from the devenv.exe process. And if I could somehow hook into that IPC mechanism then I could bypass the performance counter API altogether.
The source code of the .NET Framework is not public, but as I’ve mentioned in many of my other articles, there is a trick: since .NET Core was forked from .NET framework, you can go to the coreclr repository on github and checkout the very first commit, to get a good overview of the source code of .NET Framework before it diverged too much.
I spent some time searching but I couldn’t find what I was looking for. I did find some structures used to store the performance values, and code that updated them, but failed to understand how they were exposed to other processes.
After a while, I took a step back, ran my PDH prototype, and profiled it with the excellent Superluminal profiler to get hints of what was happening under the hood when loading a .NET performance counter provider.
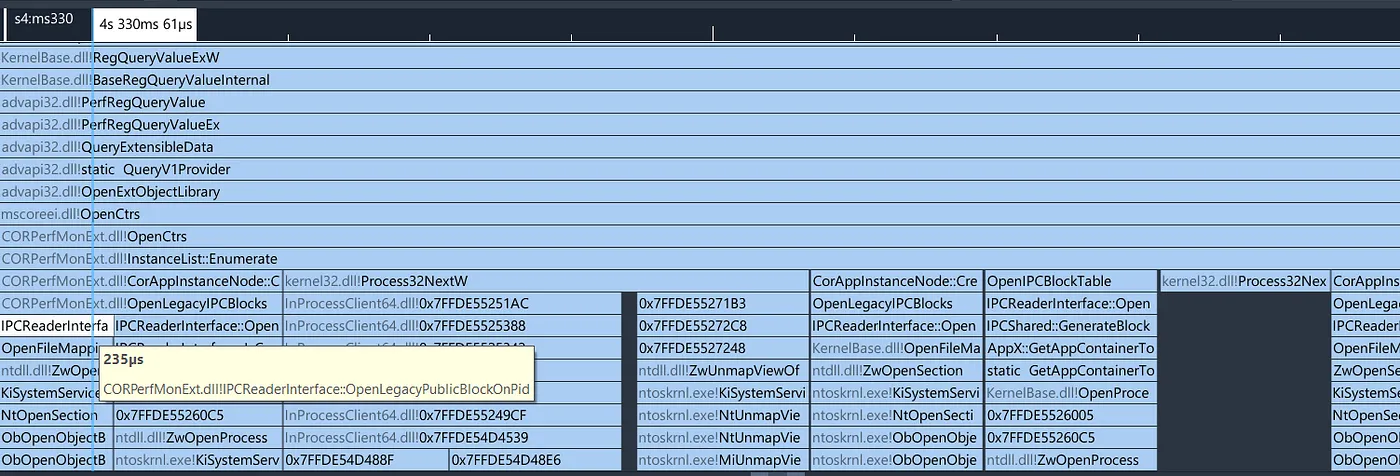
We can see a few interesting things in that stack trace:
-
First, we see a call to
RegQueryValueExW, so it looks like even PDH relies on the registry under the hood -
Then we see a call to
OpenCtrsinmscoreei.dll, this is the function that .NET exposes for its performance counter providers -
mscoreei.dllthen callsCORPerfMonExt.dll(another DLL that ships with the .NET Framework) -
CORPerfMonExt.dlluses a class namedIPCReaderInterface, which name is very encouraging given that we’re looking for some IPC mechanism
I checked into the CoreCLR repository to see if I could find the source code of that IPCReaderInterface and… there it was.
From that point onwards, it was just a matter of reading the source code of the IPCReaderInterface (and its counterpart IPCWriterInterface) to understand how it works.
The .NET Framework IPC interface
The IPC mechanism used by .NET Framework to share performance counters relies on a memory-mapped file with special permissions. The name of the memory file is Cor_SxSPublic_IPCBlock, and it’s accessible through the private namespace Cor_CLR_READER. If you want to access the file of the current process, it’s already mapped through the namespace Cor_CLR_WRITER.
The memory-mapped file contains a list of 32 “IPC control blocks”, each with a fixed size of 2KB. As far as I can tell, this is part of the infrastructure introduced in .NET Framework 4 to allow side-by-side execution with future versions of the framework. Each runtime loaded in a given process is supposed to take ownership of one of the blocks, and fill its header appropriately. Given that no .NET Framework 5 was ever released, I believe this capability has never and will never be used, which is a bit sad.
The IPC control block header contains information about the runtime that took ownership of it, and the number of entries inside of the block. Each entry can have an arbitrary size, and as far as I can tell only one entry is ever stored: the one that contains the value of the performance counters.
How to access all of this in C#?
To open the memory-mapped file from within the process, it’s fairly straightforward using the System.IO.MemoryMappedFiles namespace:
var file = MemoryMappedFile.OpenExisting(@"Cor_CLR_WRITER\Cor_SxSPublic_IPCBlock");
var view = file.CreateViewAccessor();
To open the memory-mapped file of another .NET process, you would need to map the private namespace, which is much more convoluted (and I assume would require to p/invoke the OpenPrivateNamespaceW function).
Then in theory we should browse every 2KB block to find the right one, but since those side-by-side capabilities were never used, I believe it’s safe to assume it’s always going to be the first one.
The structure of the IPC control block header translated in C# would be: (the comments are copy-pasted from the original C++ code)
[StructLayout(LayoutKind.Sequential)]
public readonly struct IPCHeader
{
    [Flags]
    public enum IpcHeaderFlags : ushort
    {
        IPC_FLAG_USES_FLAGS = 0x1,
        IPC_FLAG_INITIALIZED = 0x2,
        IPC_FLAG_X86 = 0x4
    }

    /// <summary>
    /// Value of 0 is special; means that this block has never been touched before by a writer
    /// </summary>
    public readonly int Counter;

    /// <summary>
    /// Value of 0 is special; means that chunk is currently free (runtime ids are always greater than 0)
    /// </summary>
    public readonly int RuntimeId;

    public readonly int Reserved1;
    public readonly int Reserved2;

    /// <summary>
    /// Version of the IPC Block
    /// </summary>
    public readonly ushort Version;

    /// <summary>
    /// Flags field
    /// </summary>
    public readonly IpcHeaderFlags Flags;

    /// <summary>
    /// Size of the entire shared memory block
    /// </summary>
    public readonly int BlockSize;

    /// <summary>
    /// Stamp for year built
    /// </summary>
    public readonly ushort BuildYear;

    /// <summary>
    /// Stamp for Month/Day built
    /// </summary>
    public readonly ushort BuildNumber;

    /// <summary>
    /// Number of entries in the table
    /// </summary>
    public readonly int NumEntries;

    /// <summary>
    /// Entry describing each client's block
    /// </summary>
    public readonly IPCEntry Table;
}
Table is actually a list of IPCEntry with a size of NumEntries entries. But it’s hard (impossible?) to represent in C# without using unsafe, and given that there’s ever going to be only one entry, we can ignore that.
Each IPCEntry indicates the position and the size of the entry within the block:
[StructLayout(LayoutKind.Sequential)]
public readonly struct IPCEntry
{
    /// <summary>
    /// Offset of the IPC Block from the end of the Full IPC Header
    /// </summary>
    public readonly int Offset;

    /// <summary>
    /// Size (in bytes) of the block
    /// </summary>
    public readonly int Size;
}
The entries are stored right after after the header. Once again, since there is only one entry and it’s always going to be the one for the performance counters, we can take yet another shortcut and hardcode the location of that entry:
[StructLayout(LayoutKind.Sequential)]
public readonly struct IpcControlBlock
{
    public readonly IPCHeader Header;

    public readonly PerfCounterIpcControlBlock Perf;
}
(the original C++ code is actually taking the same shortcut)
Finally, the PerfCounterIPCControlBlock contains the value of the performance counters:
[StructLayout(LayoutKind.Sequential)]
public readonly struct PerfCounterIpcControlBlock
{
    // Versioning info

    /// <summary>
    /// Size of this entire block
    /// </summary>
    public readonly short Size;

    /// <summary>
    /// Attributes for this block
    /// </summary>
    public readonly short Attributes;

    // Counter Sections
    public readonly PerfGC GC;
    public readonly PerfContexts Context;
    public readonly PerfInterop Interop;
    public readonly PerfLoading Loading;
    public readonly PerfExceptions Exceptions;
    public readonly PerfLocksAndThreads LocksAndThreads;
    public readonly PerfJit Jit;
    public readonly PerfSecurity Security;
}

[StructLayout(LayoutKind.Sequential)]
public readonly struct PerfJit
{
    /// <summary>
    /// Number of methods jitted
    /// </summary>
    public readonly int MethodsJitted;

    /// <summary>
    /// IL jitted stats
    /// </summary>
    public readonly TRICOUNT ILJitted;

    /// <summary>
    /// # of standard Jit failures
    /// </summary>
    public readonly int JitFailures;

    /// <summary>
    /// Time in JIT since last sample
    /// </summary>
    public readonly int TimeInJit;

    /// <summary>
    /// Time in JIT base counter
    /// </summary>
    public readonly int TimeInJitBase;
}

[StructLayout(LayoutKind.Sequential)]
public readonly struct PerfSecurity
{
    public readonly int TotalRuntimeChecks;

    /// <summary>
    ///  % time authenticating
    /// </summary>
    public readonly long TimeAuthorize;

    /// <summary>
    /// Link time checks
    /// </summary>
    public readonly int LinkChecks;

    /// <summary>
    /// % time in Runtime checks
    /// </summary>
    public readonly int TimeRTchecks;

    /// <summary>
    /// % time in Runtime checks base counter
    /// </summary>
    public readonly int TimeRTchecksBase;

    /// <summary>
    /// Depth of stack for security checks
    /// </summary>
    public readonly int StackWalkDepth;
}

[StructLayout(LayoutKind.Sequential)]
public readonly struct PerfLocksAndThreads
{
    /// <summary>
    /// # of times in AwareLock::EnterEpilogue()
    /// </summary>
    public readonly int Contention;

    public readonly TRICOUNT QueueLength;

    /// <summary>
    /// Number (created - destroyed) of logical threads
    /// </summary>
    public readonly int CurrentThreadsLogical;

    /// <summary>
    /// Number (created - destroyed) of OS threads
    /// </summary>
    public readonly int CurrentThreadsPhysical;

    /// <summary>
    /// # of Threads execute in runtime's control
    /// </summary>
    public readonly TRICOUNT RecognizedThreads;
}

[StructLayout(LayoutKind.Sequential)]
public readonly struct PerfExceptions
{
    /// <summary>
    /// Number of Exceptions thrown
    /// </summary>
    public readonly int Thrown;

    /// <summary>
    /// Number of Filters executed
    /// </summary>
    public readonly int FiltersExecuted;

    /// <summary>
    /// Number of Finallys executed
    /// </summary>
    public readonly int FinallysExecuted;

    /// <summary>
    /// Delta from throw to catch site on stack
    /// </summary>
    public readonly int ThrowToCatchStackDepth;
}

[StructLayout(LayoutKind.Sequential)]
public readonly struct PerfLoading
{
    public readonly TRICOUNT ClassesLoaded;

    /// <summary>
    /// Current # of AppDomains
    /// </summary>
    public readonly TRICOUNT AppDomains;

    /// <summary>
    /// Current # of Assemblies
    /// </summary>
    public readonly TRICOUNT Assemblies;

    /// <summary>
    /// % time loading
    /// </summary>
    public readonly long TimeLoading;

    /// <summary>
    /// Avg search length for assemblies
    /// </summary>
    public readonly int AsmSearchLength;

    /// <summary>
    /// Classes Failed to load
    /// </summary>
    public readonly int LoadFailures;

    /// <summary>
    /// Total size of heap used by the loader
    /// </summary>
    public readonly nint LoaderHeapSize;

    /// <summary>
    /// Rate at which app domains are unloaded
    /// </summary>
    public readonly int AppDomainsUnloaded;
}

[StructLayout(LayoutKind.Sequential)]
public readonly struct PerfInterop
{
    /// <summary>
    /// Number of CCWs
    /// </summary>
    public readonly int CCW;

    /// <summary>
    /// Number of stubs
    /// </summary>
    public readonly int Stubs;

    /// <summary>
    /// # of time marshalling args and return values
    /// </summary>
    public readonly int Marshalling;

    /// <summary>
    /// Number of tlbs we import
    /// </summary>
    public readonly int TLBImports;

    /// <summary>
    /// Number of tlbs we export
    /// </summary>
    public readonly int TLBExports;
}

[StructLayout(LayoutKind.Sequential)]
public readonly struct PerfContexts
{
    /// <summary>
    /// # of remote calls
    /// </summary>
    public readonly int RemoteCalls;

    /// <summary>
    /// Number of current channels
    /// </summary>
    public readonly int Channels;

    /// <summary>
    /// Number of context proxies
    /// </summary>
    public readonly int Proxies;

    /// <summary>
    /// # of Context-bound classes
    /// </summary>
    public readonly int Classes;

    /// <summary>
    /// # of context bound objects allocated
    /// </summary>
    public readonly int ObjAlloc;

    /// <summary>
    /// The current number of contexts
    /// </summary>
    public readonly int Contexts;
}

[StructLayout(LayoutKind.Sequential)]
public readonly struct PerfGC
{
    /// <summary>
    /// Count of collects gen 0
    /// </summary>
    public readonly nint GenCollections0;

    /// <summary>
    /// Count of collects gen 1
    /// </summary>
    public readonly nint GenCollections1;

    /// <summary>
    /// Count of collects gen 2
    /// </summary>
    public readonly nint GenCollections2;

    /// <summary>
    /// Count of promoted memory from gen 0
    /// </summary>
    public readonly nint PromotedMem0;

    /// <summary>
    /// Count of promoted memory from gen 1
    /// </summary>
    public readonly nint PromotedMem1;

    /// <summary>
    /// Count of memory promoted due to finalization
    /// </summary>
    public readonly nint PromotedFinalizationMem;

    /// <summary>
    /// Process ID
    /// </summary>
    public readonly nint ProcessID;

    /// <summary>
    /// Size of heaps gen 0
    /// </summary>
    public readonly nint GenHeapSize0;

    /// <summary>
    /// Size of heaps gen 1
    /// </summary>
    public readonly nint GenHeapSize1;

    /// <summary>
    /// Size of heaps gen 2
    /// </summary>
    public readonly nint GenHeapSize2;

    /// <summary>
    /// Total number of committed bytes
    /// </summary>
    public readonly nint TotalCommittedBytes;

    /// <summary>
    /// Bytes reserved via VirtualAlloc
    /// </summary>
    public readonly nint TotalReservedBytes;

    /// <summary>
    /// Size of Large Object Heap
    /// </summary>
    public readonly nint LargeObjSize;

    /// <summary>
    /// Count of instances surviving from finalizing
    /// </summary>
    public readonly nint SurviveFinalize;

    /// <summary>
    /// Count of GC handles
    /// </summary>
    public readonly nint Handles;

    /// <summary>
    /// Bytes allocated
    /// </summary>
    public readonly nint Alloc;

    /// <summary>
    /// Bytes allocated for Large Objects
    /// </summary>
    public readonly nint LargeAlloc;

    /// <summary>
    /// Number of explicit GCs
    /// </summary>
    public readonly nint InducedGCs;

    /// <summary>
    /// Time in GC
    /// </summary>
    public readonly int TimeInGC;

    /// <summary>
    /// Must follow time in GC counter
    /// </summary>
    public readonly int TimeInGCBase;

    /// <summary>
    /// # of Pinned Objects
    /// </summary>
    public readonly nint PinnedObj;

    /// <summary>
    /// # of sink blocks
    /// </summary>
    public readonly nint SinkBlocks;
}
Note that some fields have a variable size and depend on the bitness of the process (nint). It means that if you want to read the counters of an external process, you will need a 32 bit and a 64 bit version of those structures, and use the right one accordingly.
Now we just need to read the structure from the memory-mapped file and we’re done. Just as a sanity check, I read the value of the “process id” counter and compare it to the expected value:
internal class Program
{
    static void Main(string[] args)
    {
        var file = MemoryMappedFile.OpenExisting(@"Cor_CLR_WRITER\Cor_SxSPublic_IPCBlock");
        var view = file.CreateViewAccessor();

        if (GC.CollectionCount(0) == 0)
        {
            // We must make sure that the GC has run at least once,
            // otherwise the GC structure that we use for the sanity check will be empty.
            GC.Collect(0, GCCollectionMode.Forced, blocking: true);
        }

        view.Read<IpcControlBlock>(0, out var controlBlock);

        Console.WriteLine($"Process id from perf counters: {controlBlock.Perf.GC.ProcessID}, expected: {Process.GetCurrentProcess().Id}");
    }
}
I made the structs readonly, but just for fun we can make them mutable and write our own value to the performance counters:
 'fun', exhibit A
Wrapping up
To read the value of the performance counters in the current process, this approach has multiple advantages:
-
It’s fast. It’s litteraly just reading a value in memory. It should even be possible to avoid the copy of the struct by using some unsafe code (there are some pending API proposals to make it safe).
-
It’s reliable. It feels weird saying that given that it relies on reverse-engineered undocumented behavior, but it’s definitely safer than loading and calling arbitrary performance counter providers.
-
It has a better compatibility. You need additional permissions to read performance counters when running in IIS, which can be especially troublesome when running in sandboxed environments such as Azure App Services. Here we don’t have this issue because a given process always has the permissions to read its own memory-mapped file.
-
You don’t have to struggle to find the right instance when multiple processes share the same name.
You can find the full code in the Datadog/dd-trace-dotnet repository.