Showing unresolved functions in PerfView
One thing that has bothered me quite a bit with PerfView is how it groups all unresolved frames under the same “?!?” name. I understand that it’s a way to reduce noise, but when trying to reduce the CPU usage of an application it can be unsettling.
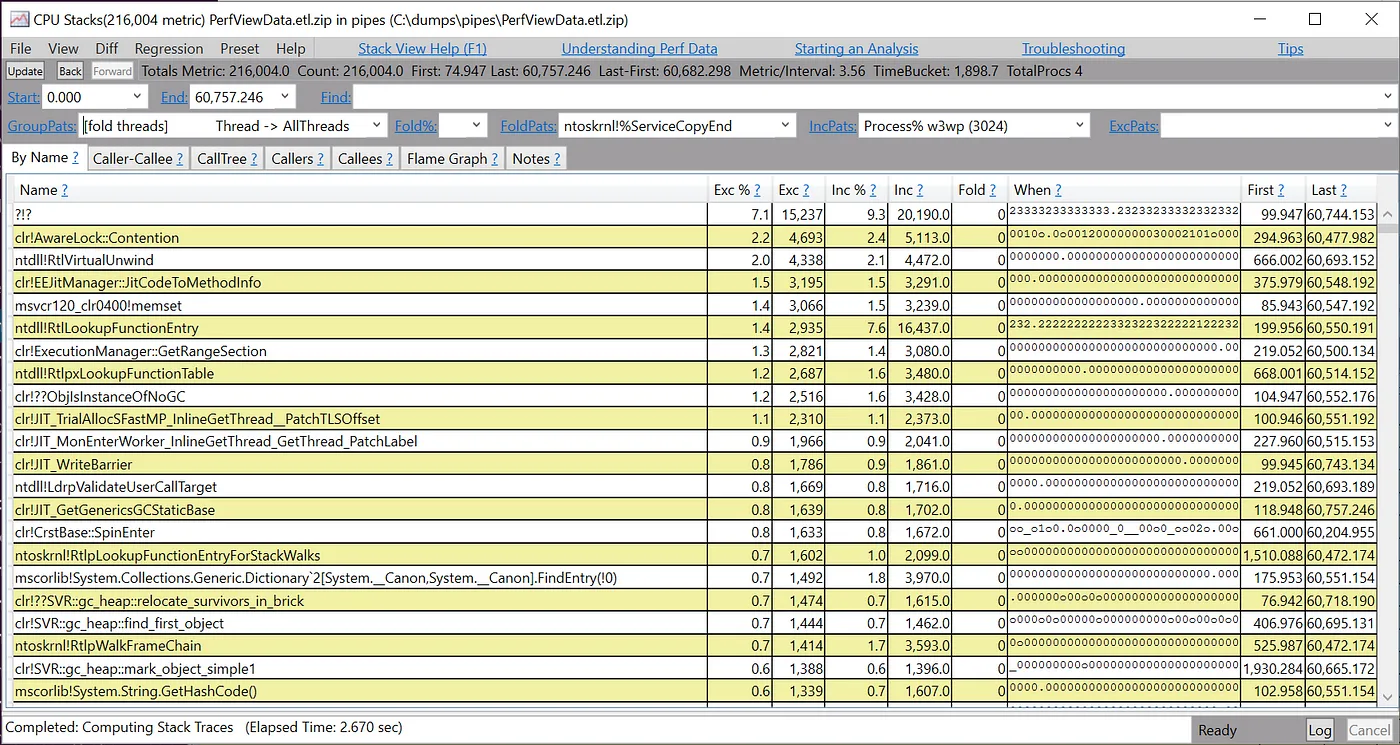
Take the following example:
Here, “?!?” is presented as top offender, accounting for more than 7% of the total CPU usage. But I’m missing critical information to know whether I should consider it as a bottleneck or not. If there’s a single unresolved function accounting for 7% of the total CPU then I definitely need to investigate. But if there are 70 unresolved functions, each using 0.1% of the CPU and grouped under the same “?!?” label, then I really don’t care.
It turns out there’s a way to disable that behavior. You need to give a special parameter when launching PerfView:
$ perfview.exe -ShowUnknownAddresses
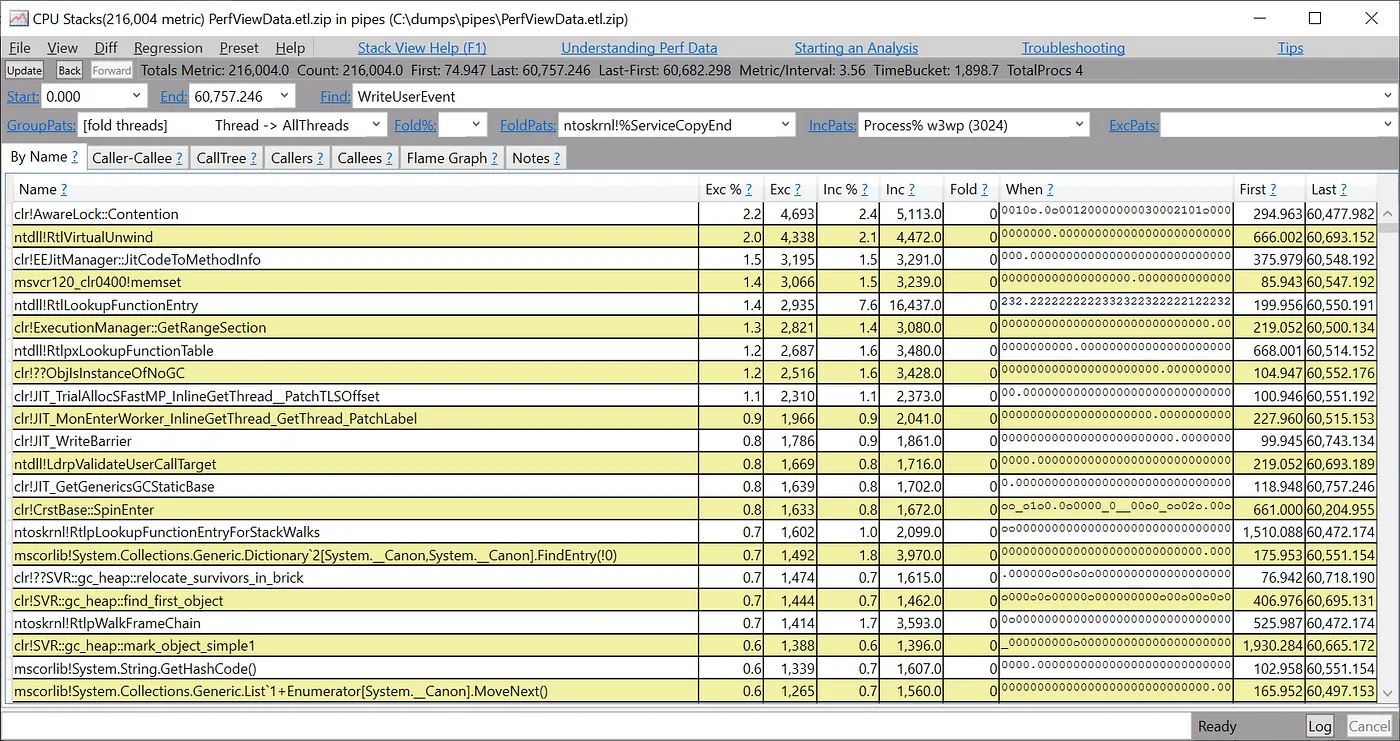
Then just open the same trace, and PerfView will show the address of the unresolved frames (for instance: ?!0xfffff801e2dfc003) instead of grouping them all under “?!?”. When looking at the overview, it gives a very different picture:
Now the unresolved functions don’t even appear in the top offenders anymore, and I know I can focus on something else.


