This story begins when one of our integrations tests started got stuck on one PR that seemingly impacted unrelated code. This is a nice excuse to cover some concepts I haven’t touched in my previous articles, such as downloading the .NET symbols on Linux.
This is the second part of an investigation where I tried to understand why an application was randomly crashing with an
AccessViolationException
. This part starts when, as I ran out of easy things to try, I decided to map the assembly code of the IsLockHeld
method to the original C++ code to understand exactly where it crashed.
Investigating a crash in a .NET application, caused by an AccessViolationException when inspecting the state of a lock.
In this series of article, we’re retracing how I debugged an
InvalidProgramException
, caused by a bug in the Datadog profiler, from a memory dump sent by a customer. This is the last part of the investigation, about figuring out what is wrong with the IL code.
In this series of article, we’re retracing how I debugged an InvalidProgramException, caused by a bug in the Datadog profiler, from a memory dump sent by a customer. In this part, we extract the dynamic IL from the memory dump.
In this series of article, we’re retracing how I debugged an InvalidProgramException, caused by a bug in the Datadog profiler, from a memory dump sent by a customer. The first part of the investigation is an introduction to using a memory dump from a .NET application to find the information you seek.
Even with years of experience, WebRequest managed to surprise me.
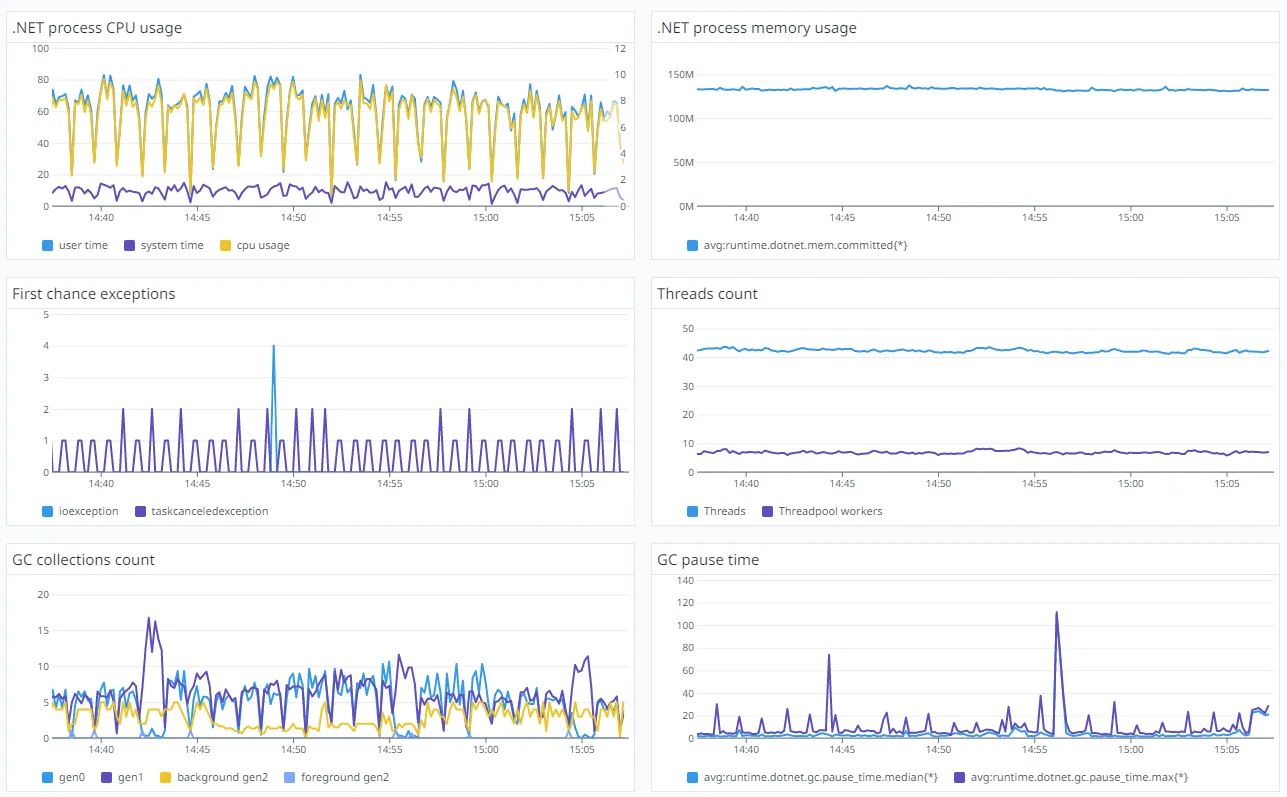
Using startup hooks to automatically fetch GC metrics from any .net core application.
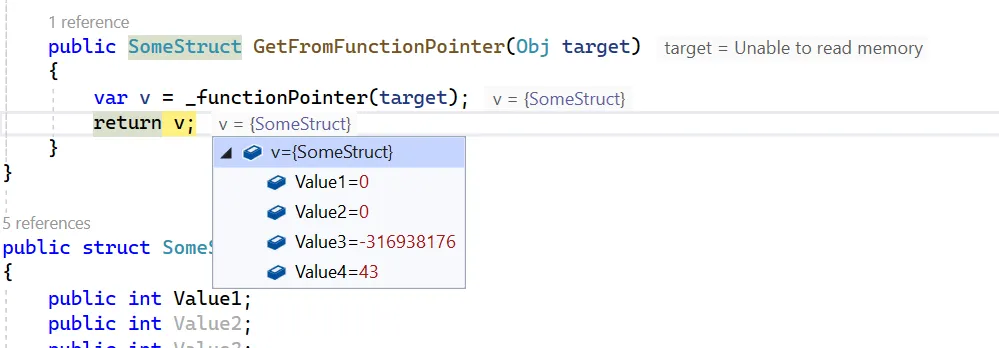
How to inspect arbitrary values in the memory of a .net process on Linux… And find an unexpected bug in the process.
Non-exhaustive list of code patterns to avoid in C#, either because they are risky or perform poorly.