Digging into a bug in the .NET ARM64 runtime, learning about dispatch stubs, and using that knowledge to diagnose a NullReferenceException.
This story begins when one of our integrations tests started got stuck on one PR that seemingly impacted unrelated code. This is a nice excuse to cover some concepts I haven’t touched in my previous articles, such as downloading the .NET symbols on Linux.
In this series of article, we’re retracing how I debugged an
InvalidProgramException
, caused by a bug in the Datadog profiler, from a memory dump sent by a customer. This is the last part of the investigation, about figuring out what is wrong with the IL code.
In this series of article, we’re retracing how I debugged an InvalidProgramException, caused by a bug in the Datadog profiler, from a memory dump sent by a customer. In this part, we extract the dynamic IL from the memory dump.
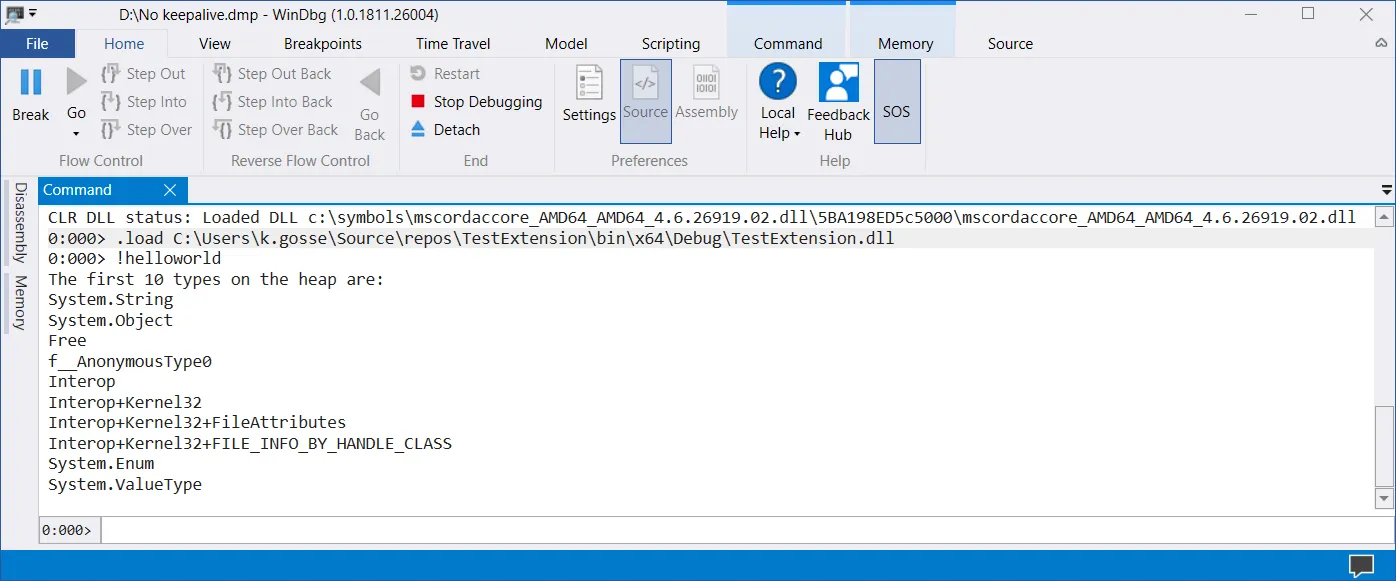
Guide on how to write debugger extensions that are compatible with both WinDbg and LLDB.