Writing a .NET profiler in C# - Part 1
.NET has a very powerful profiling API, that allows to closely monitor the runtime, dynamically rewrite methods during execution, walk the callstack of threads at arbitrary points in time, and much more. However, the entry cost to learn how to use that API is quite high. The first reason is that many features require a good knowledge of how the .NET metadata system works. The other reason is that all the documentation and examples are written in C++.
In theory, most languages could be used to write a .NET profiler. For instance, there is this proof-of-concept using Rust. But it has been close to impossible to use C#. If the profiler is a .NET library, it will use the same runtime as the profiled application, which causes a few issues:
-
Since the profiler would be a .NET library, it would end up profiling itself. This is more problematic than it sounds. For instance, when a method in the profiled application is compiled, the runtime raises the profiling event
JITCompilationStarted. This would invoke a callback in the profiler, which needs first to be compiled by the JIT. So that would raise anotherJITCompilationStartedevent, which would invoke the callback, which would need first to be compiled by the JIT, so that would raise anotherJITCompilationStarted… You get my point. -
Even if you manage to find a fix for that problem, there is a much more practical one: the profiler is loaded very early during the runtime initialization, at a point where the system is not ready to run .NET code.
I’ve always felt like it was a shame, because C# is by far the language C# developers are the most familiar with. Fortunately, the situation has changed.
I’ve already mentioned it in a previous article, Microsoft is actively working on NativeAOT. This tool allows to compile a .NET library into a native, standalone library. Standalone is the key here: because it comes with its own runtime (its own GC, its own threadpool, its own type system…), it can be loaded into a process with exactly the same limitations as any native library. Which means that we can in theory use it to write a .NET profiler in C#.
The setup
To learn how to write a .NET profiler, you can refer to the articles written by Christophe Nasarre. In a nutshell, we need to expose a DllGetClassObject method that will return an instance of IClassFactory. The .NET runtime will call the CreateInstance method on the class factory, which will return an instance of ICorProfilerCallback (or ICorProfilerCallback2, ICorProfilerCallback3, …, depending on which version of the profiling API we want to support). Last but not least, the runtime will call the Initialize method on that instance with an IUnknown parameter that we can use to fetch an instance of ICorProfilerInfo (or ICorProfilerInfo2, ICorProfilerInfo3, …) that we will need to query the profiling API.
Well that’s a lot. Let’s start with the first step: exporting a DllGetClassObject method. First we create a .NET 6 class library project, and add a reference to Microsoft.DotNet.ILCompiler in version 7.0.0-preview.*. Then we create a DllMain class (the name doesn’t really matter) with a DllGetClassObject method. We also decorate this method with a UnmanagedCallersOnly attribute to instruct the NativeAOT toolchain to export the method.
using System;
using System.Runtime.InteropServices;

namespace ManagedDotnetProfiler;

public class DllMain
{
    [UnmanagedCallersOnly(EntryPoint = "DllGetClassObject")]
    public static unsafe int DllGetClassObject(Guid* rclsid, Guid* riid, IntPtr* ppv)
    {
        Console.WriteLine("Hello from the profiling API");

        return 0;
    }
}
Then we run the dotnet publish command with the /p:NativeLib=Shared command to generate a native library:
$ dotnet publish /p:NativeLib=Shared /p:SelfContained=true -r win-x64 -c Release
The output is a .dll file (or .so on Linux). To test that everything is working as expected, we can launch any .NET console application after setting the right environment variables:
set CORECLR_ENABLE_PROFILING=1
set CORECLR_PROFILER={B3A10128-F10D-4044-AB27-A799DB8B7E4F}
set CORECLR_PROFILER_PATH=C:\git\ManagedDotnetProfiler\ManagedDotnetProfiler\bin\Release\net6.0\win-x64\publish\ManagedDotnetProfiler.dll
CORECLR_ENABLE_PROFILING instructs the runtime to load the profiler. CORECLR_PROFILER is a GUID uniquely identifying the profiler (any value will do for now). CORECLR_PROFILER_PATH is the path to the dll we published with NativeAOT. If everything worked properly, you should see the message displayed during the loading of the target app:
C:\console\bin\Debug\net6.0>console.exe
Hello from the profiling API
Hello, World!
That’s great, but not really useful yet. How to write an actual profiler? We now need to understand how to expose an instance of IClassFactory.
Exposing a C++ interface (kind of)
The MSDN documentation indicates that IClassFactory is an interface. But “interface” means different things in C++ and C#, so we can’t just implement an IClassFactory in our .NET code and call it a day.
As a matter of fact, the concept of interface doesn’t really exist in C++. In practice, it just designates an abstract class that only contains pure virtual functions. So we need to build and expose an object that will look like a C++ abstract class. For that, we need to understand the concept of vtable.
Imagine we have an interface IInterface with a single method DoSomething, and two implementations, ClassA and ClassB. Because both ClassA and ClassB can declare their own implementation of DoSomething, the runtime needs a level of indirection to know which one to invoke when given a pointer to an instance of IInterface. This indirection is called the virtual table, or vtable.
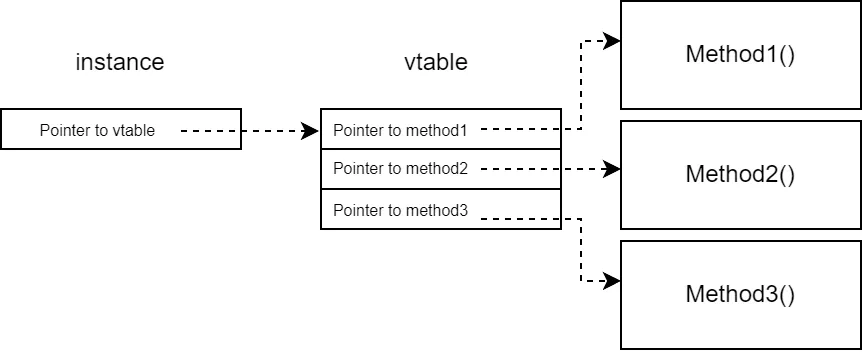
By convention, when a class implements virtual methods, the C++ compiler emits a hidden field at the beginning of the object. That hidden field contains a pointer to the vtable. The vtable is a chunk of memory that contains the address of the implementation of each virtual method, in the order they are declared. When invoking a virtual method, the runtime will first fetch the vtable, then use it to get the address of the implementation.
There are more specificities to the vtable, for instance to handle multiple inheritance, but we don’t need to know about those for this article.
To summarize, to create an IClassFactory object that can be used by the C++ runtime, we need to allocate a chunk of memory to store the address of our functions. This is our vtable. Then we need another chunk of memory that contains a pointer to the vtable. This is our instance.
For simplicity, we can merge the instance and the vtable into a single chunk of memory:
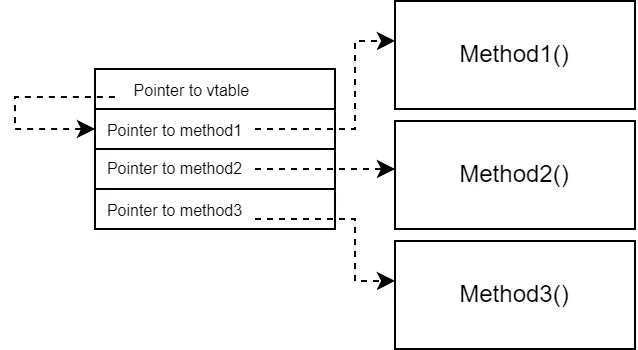
So what does it look like in C#? First we declare a static method for each function in the IClassFactory interface, and decorate them with UnmanagedCallersOnly:
[UnmanagedCallersOnly]
public static unsafe int QueryInterface(IntPtr self, Guid* guid, IntPtr* ptr)
{
    Console.WriteLine("QueryInterface");
    *ptr = IntPtr.Zero;
    return 0;
}

[UnmanagedCallersOnly]
public static int AddRef(IntPtr self)
{
    Console.WriteLine("AddRef");
    return 1;
}

[UnmanagedCallersOnly]
public static int Release(IntPtr self)
{
    Console.WriteLine("Release");
    return 1;
}

[UnmanagedCallersOnly]
public static unsafe int CreateInstance(IntPtr self, IntPtr outer, Guid* guid, IntPtr* instance)
{
    Console.WriteLine("CreateInstance");
    *instance = IntPtr.Zero;
    return 0;
}

[UnmanagedCallersOnly]
public static int LockServer(IntPtr self, bool @lock)
{
    return 0;
}
Then, in DllGetClassObject, we allocate the chunk of memory that will be used to store the pointer to the vtable (our fake instance) and the vtable itself. Since this memory will be used by native code, we must make sure it won’t be moved by the garbage collector. We could declare an array of IntPtr and pin it, but I prefer to instead use NativeMemory.Alloc to allocate memory that won’t be tracked by the GC. To get the addresses of our static methods, we can cast them to function pointers, then to IntPtr. Finally, we return the address of the chunk of memory through the ppv argument of the function.
[UnmanagedCallersOnly(EntryPoint = "DllGetClassObject")]
public static unsafe int DllGetClassObject(Guid* rclsid, Guid* riid, IntPtr* ppv)
{
    Console.WriteLine("Hello from the profiling API");

    // Allocate the chunk of memory for the vtable pointer + the pointers to the 5 methods
    var chunk = (IntPtr*)NativeMemory.Alloc(1 + 5, (nuint)IntPtr.Size);

    // Pointer to the vtable
    *chunk = (IntPtr)(chunk + 1);

    // Pointers to each method of the interface
    *(chunk + 1) = (IntPtr)(delegate* unmanaged<IntPtr, Guid*, IntPtr*, int>)&QueryInterface;
    *(chunk + 2) = (IntPtr)(delegate* unmanaged<IntPtr, int>)&AddRef;
    *(chunk + 3) = (IntPtr)(delegate* unmanaged<IntPtr, int>)&Release;
    *(chunk + 4) = (IntPtr)(delegate* unmanaged<IntPtr, IntPtr, Guid*, IntPtr*, int>)&CreateInstance;
    *(chunk + 5) = (IntPtr)(delegate* unmanaged<IntPtr, bool, int>)&LockServer;

    *ppv = (IntPtr)chunk;

    return HResult.S_OK;
}
After compiling and testing, we can see that the CreateInstance method of our fake IClassFactory is called as expected:
C:\console\bin\Debug\net6.0> .\console.exe
Hello from the profiling API
CreateInstance
Release
Hello, World!
We’re just getting started
The next step would be to implement that CreateInstance method. As explained earlier, we are expected to return an instance of ICorProfilerCallback. To implement this interface, we could do the same thing as we just did for IClassFactory, however ICorProfilerCallback contains almost 70 methods! That’s a lot of boilerplate code to write, not mentioning ICorProfilerCallback2, ICorProfilerCallback3 and so on. Plus, our current solution only works with static methods, it would be really nice to have something that works with instance methods. In the next article of the series, we will see how to solve those issues.