AccessViolation in ObjectNative::IsLockHeld (part 1 of 2)
This is a two parts article. Part two is available here.
Symptoms
To monitor the stability of the Datadog .NET tracer, we have a reliability environment where we continuously run mainstream applications such as Orchard. This story starts when, while preparing a release, we discovered that the latest version of our tracer was crashing the app with the message:
Application: w3wp.exe Framework Version: v4.0.30319 Description: The process was terminated due to an internal error in the .NET Runtime at IP 00007FFB62CB0A8D (00007FFB625B0000) with exit code 80131506.
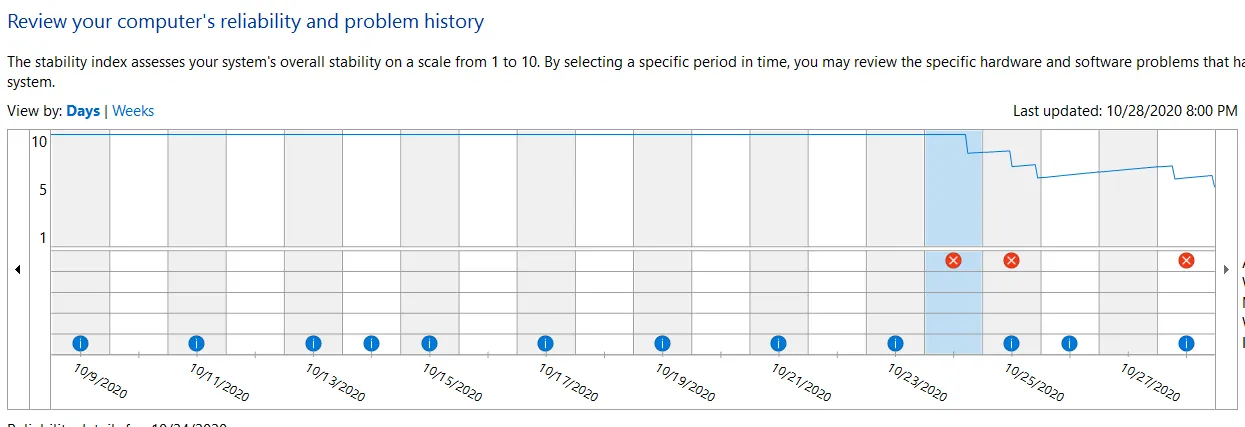
A look at the reliability monitor showed that the app was crashing once or twice per day:
Unfortunately I couldn’t tell much from the error message. You can’t normally cause this kind of crash from managed code (unless of course you use unsafe), so I scanned the changes we made to our native libraries and found nothing suspicious. As there wasn’t anything more I could do, I configured the server to capture a memory dump at next crash, and waited.
Thankfully the app crashed again during the night, and I could start my analysis in the morning.
Into the crash dump
Just by opening the dump, WinDbg gives a bit more information about the error:
This dump file has an exception of interest stored in it.
The stored exception information can be accessed via .ecxr.
(13c0.16f0): Access violation - code c0000005 (first/second chance not available)
For analysis of this file, run !analyze -v
clr!ObjectNative::IsLockHeld+0x4d:
00007ffb`62cb0a8d 8b592c          mov     ebx,dword ptr [rcx+2Ch] ds:00000000`0000002b=????????
The error tells us two thing: the issue occurred in clr!ObjectNative::IsLockHeld, and we tried to read the memory at address 0x2B. 0x2B is clearly not a valid address, and it looks like an “actual” value rather than something random. I tried running !clrstack to get the managed stacktrace, but the command was not working. At this point I started suspecting that something overwrote values on the stack, causing the crash.
Getting the native stacktrace worked, but it only gave me addresses for the managed frames:
0:045> k
 # Child-SP          RetAddr               Call Site
00 000000d9`67bfdca0 00007ffb`064c776f     clr!ObjectNative::IsLockHeld+0x4d
01 000000d9`67bfdcd0 00007ffb`064c771a     0x00007ffb`064c776f
02 000000d9`67bfdd00 00007ffb`059d6983     0x00007ffb`064c771a
03 000000d9`67bfdd30 00007ffb`059d6842     0x00007ffb`059d6983
04 000000d9`67bfdd80 00007ffb`059d68cc     0x00007ffb`059d6842
05 000000d9`67bfddb0 00007ffb`059d6842     0x00007ffb`059d68cc
06 000000d9`67bfde00 00007ffb`05a1d031     0x00007ffb`059d6842
07 000000d9`67bfde30 00007ffb`05a1cfbf     0x00007ffb`05a1d031
08 000000d9`67bfde90 00007ffb`0388f1bf     0x00007ffb`05a1cfbf
09 000000d9`67bfdf00 00007ffb`0388dd34     0x00007ffb`0388f1bf
0a 000000d9`67bfdfd0 00007ffb`03acd942     0x00007ffb`0388dd34
0b 000000d9`67bfe000 00007ffb`0676e69c     0x00007ffb`03acd942
0c 000000d9`67bfe050 00007ffb`03a82752     0x00007ffb`0676e69c
0d 000000d9`67bfe0b0 00007ffb`03c9deb5     0x00007ffb`03a82752
[...]
45 000000d9`67bff8c0 00007ffb`707084d4     clr!Thread::intermediateThreadProc+0x86
46 000000d9`67bffe00 00007ffb`7081e871     kernel32!BaseThreadInitThunk+0x14
47 000000d9`67bffe30 00000000`00000000     ntdll!RtlUserThreadStart+0x21
Fortunately, I could resolve them with the ip2md command:
0:045> !ip2md 0x00007ffb`064c776f
MethodDesc:   00007ffb05c99698
Method Name:  Orchard.OutputCache.Filters.OutputCacheFilter.Dispose(Boolean)
Class:        00007ffb05ca3f18
MethodTable:  00007ffb05c996f8
mdToken:      000000000600013e
Module:       00007ffb05c58508
IsJitted:     yes
CodeAddr:     00007ffb064c7750
Transparency: Critical
By checking the Orchard source code, we can confirm that OutputCacheFilter.Dispose indeed calls Monitor.IsEntered :
protected virtual void Dispose(bool disposing) {
    if (!_isDisposed) {
        if (disposing) {
            // Free other state (managed objects).
        }

        if (_cacheKey != null && Monitor.IsEntered(_cacheKey)) {
            Monitor.Exit(_cacheKey);
        }

        _isDisposed = true;
    }
}
It sounds reasonable to assume that Monitor.IsEntered is going to call ObjectNative::IsLockHeld , but just for the sake of it we can confirm it.
First, the source code of the BCL on .NET Framework shows that Monitor.IsEntered calls Monitor.IsEnteredNative , which is implemented in the CLR. Unfortunately we don’t have the code of the .NET Framework CLR, but the .NET Core one is usually close enough. And indeed, we can see that Monitor.IsEnteredNative is mapped to ObjectNative::IsLockHeld , as expected:
FCFuncElement("IsEnteredNative", ObjectNative::IsLockHeld)
Looking further at the Orchard code, I could see that the OutputCacheFilter is locking on an interned string. That’s a dangerous pattern, but not necessarily wrong. I suppose they did that as a cheap way of ensuring all instances share the same locks.
Where to look next? I wanted to check the instance of string that was given to Monitor.IsEntered , to see if there was anything suspicious about it, but I couldn’t find it on the stack. So I focused instead on the native code.
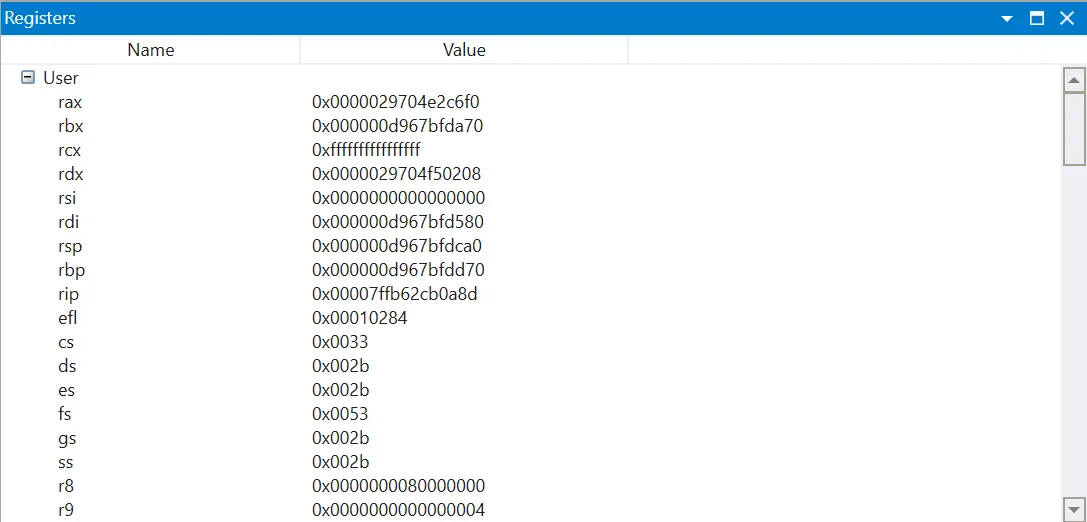
The error occurred when executing the instruction mov ebx,dword ptr [rcx+2Ch], meaning: “read the memory at the address rcx+0x2C, and store it in ebx”. I used the WinDbg Registers window to check the value of the registers at the time of the error:
The value of rcx was 0xffffffffffffffff (that is, -1). This explained where the 0x2B came from: rcx + 2C = -1 + 2C = 2B . 2C was probably the offset of a field in an object, so it looked like the address of that object was wrong.
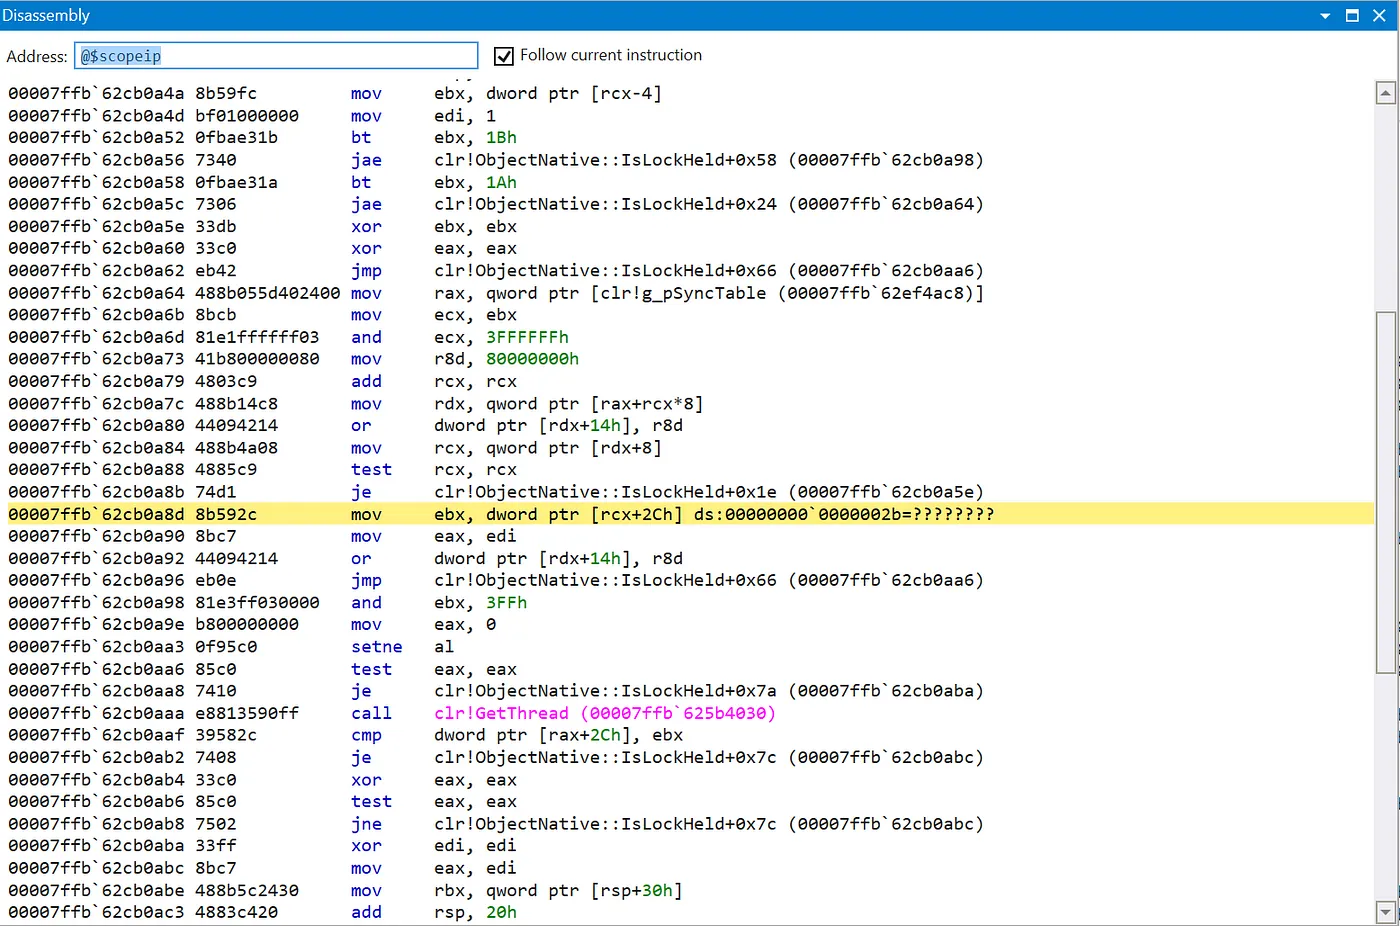
I then decided to check where the value in rcx came from. The disassembly window of WinDbg shows the assembly code near the exception:
rcx was written for the last time by the instruction mov rcx, qword ptr [rdx+8], with rdx having a value of 0x0000029704f50208. It looked like an address, so I tried to figure out what kind. The value of the stack pointer register, rsp , was 0x000000d967bfdca0, so definitely not a stack address. The managed heap maybe? The command !eeheap -gc gives the range of all the GC segments, and allowed me to confirm that 0x0000029704f50208 was not on the managed heap either.
At this point, I decided to take a step back. IsLockHeld takes only one parameter: the object used for locking. Therefore, I could think of only 3 possibilities to explain the error:
-
The address of the parameter was wrong
-
The sync table was corrupted
-
The header of the object (with the index to the sync table) was corrupted
Wait, what “sync table”? Let’s introduce the concept for those who are not familiar with it.
The sync table
Whenever you lock on an object, either by using lock (obj) or Monitor.Enter(obj) , the CLR has to keep track of what thread owns the lock in a specific data structure. As much as possible, the CLR tries to stores that information in the object header. Since the header is next to the object itself, it’s almost guaranteed to be present in the CPU cache, which makes the lock really fast. This kind of lock is called a thin lock.
Unfortunately, the object header is only 4 bytes long, so the amount of data it can store is very limited. It’s going to run out of room in two situations:
-
When the lock is contended (e.g. if multiple threads are trying to acquire it at the same time). In this case, the runtime needs to store the list of threads waiting on the lock, to wake them up when it is released.
-
When
GetHashcodeis called on the object.
Let’s elaborate a bit on that last point. Have you ever wondered what happens when you call GetHashCode on an object? The runtime needs to generate a hashcode that satisfies at least two properties:
-
The probability of another object having the same hashcode must be low
-
The hashcode of a given object must not change over time
At first I thought using the address of the object would be an elegant solution, but it doesn’t work because the address of an object can actually change (during a garbage collection). So instead the runtime just generates a random value, but since the value needs to be stable it has to be stored somewhere. And that “somewhere” is the object header.
There isn’t enough room in the object header to store both the thin lock and the hashcode. So when the header runs out of room, the information is moved to a structure named a sync block. The address of all the sync blocks is stored in a table, named the sync block table, or sync table. And the index of the sync block in the table is stored in the object header.
You can find a more detailed explanation and an estimation of the performance overhead of a sync block versus a thin lock in this excellent article.
Back to the memory dump
Now that everybody knows what the sync table is, let’s remind my 3 theories:
-
The address of the parameter was wrong
-
The sync table was corrupted
-
The header of the object (with the index to the sync table) was corrupted
In WinDbg, you can use the !syncblk command to dump all the sync blocks that contain a lock currently owned by a thread:
0:045> !syncblk
Index SyncBlock MonitorHeld Recursion Owning Thread Info  SyncBlock Owner
  226 0000029703e38fa8            1         1 0000029704768650 Failed to request Thread at 0000029704768650
The Failed to request Thread at 0000029704768650 message is very suspicious. Could it be a sign of data corruption? I decided to have a look to the full sync table, using the command !syncblk -all :
0:045> !syncblk -all
Index SyncBlock MonitorHeld Recursion Owning Thread Info  SyncBlock Owner
    1 0000000000000000            0         0 0000000000000000     none           0 Free
    2 00000296facff698            0         0 0000000000000000     none    00000295b0301da0 System.__ComObject
    3 00000296facff6e8            0         0 0000000000000000     none    00000295b0301dd8 System.Web.Hosting.ProcessHost
    4 00000296facff738            0         0 0000000000000000     none    00000295b0307b30 Microsoft.Win32.UnsafeNativeMethods+ManifestEtw+EtwEnableCallback
[...]
  224 0000000000000000            0         0 0000000000000000     none           0 Free
  225 0000000000000000            0         0 0000000000000000     none           0 Free
  226 0000029703e38fa8            1         1 0000029704768650 Failed to request Thread at 0000029704768650
It is very suspicious that the output would stop right after the Failed to request Thread error. I don’t know if it means that the table has 226 entries and there was coincidentally an error at the last one, or if the output stopped on the first error.
In any case, the address of the sync blocks, given in the second column, was very interesting. The last entry, 0x0000029703e38fa8 , was quite close to the value I found in the rcx register (0x0000029704f50208). The “corrupted sync block” theory seemed more and more plausible. But I checked the source code of IsLockHeld and it was only reading memory, not writing anything.
Since the code of the .NET Framework CLR is not available, a good approximation is to look at the very first commit of the dotnet/coreclr repository, before the code diverged too much.
FCIMPL1(FC_BOOL_RET, ObjectNative::IsLockHeld, Object* pThisUNSAFE)
{
    FCALL_CONTRACT;

    BOOL retVal;
    DWORD owningThreadId;
    DWORD acquisitionCount;

    //
    // If the lock is held, check if it's held by the current thread.
    //
    retVal = pThisUNSAFE->GetThreadOwningMonitorLock(&owningThreadId, &acquisitionCount);
    if (retVal)
        retVal = GetThread()->GetThreadId() == owningThreadId;

    FC_RETURN_BOOL(retVal);
}
FCIMPLEND
So if some value in the sync block was corrupted, it meant this happened before the IsLockedHeld method was called.
To get further, I needed to understand exactly what was corrupted. In other words, what was the code trying to read when it got the 0xffffffffffffffff value?
Mapping the assembly code to the original C++ was going to take a lot of effort, so I decided to first wait for another occurrence of the crash to confirm that the symptoms were identical. Fortunately, a fresh new crash dump was waiting for me on the server. This will be the subject of the next part!


