When the tool you write to debug crashes crashes. A story of advanced printf-debugging.
Using NativeAOT and ClrMD to write a native WinDbg extension in .NET.
How to find an instance of System.Threading.Thread by id in WinDbg, with a .NET Core memory dump.
This article explains how AsyncLocal values are stored in .NET and how to retrieve them from a memory dump.
Browse memory structures from a memory dump in C#, just like you would with ClrMD, but in a more fluent way.
Digging into a bug in the .NET ARM64 runtime, learning about dispatch stubs, and using that knowledge to diagnose a NullReferenceException.
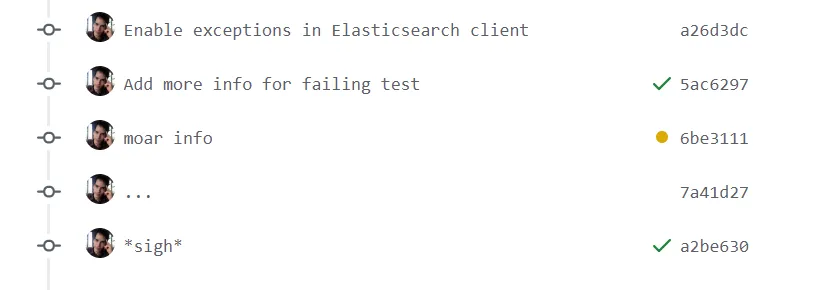
This story begins when one of our integrations tests started got stuck on one PR that seemingly impacted unrelated code. This is a nice excuse to cover some concepts I haven’t touched in my previous articles, such as downloading the .NET symbols on Linux.
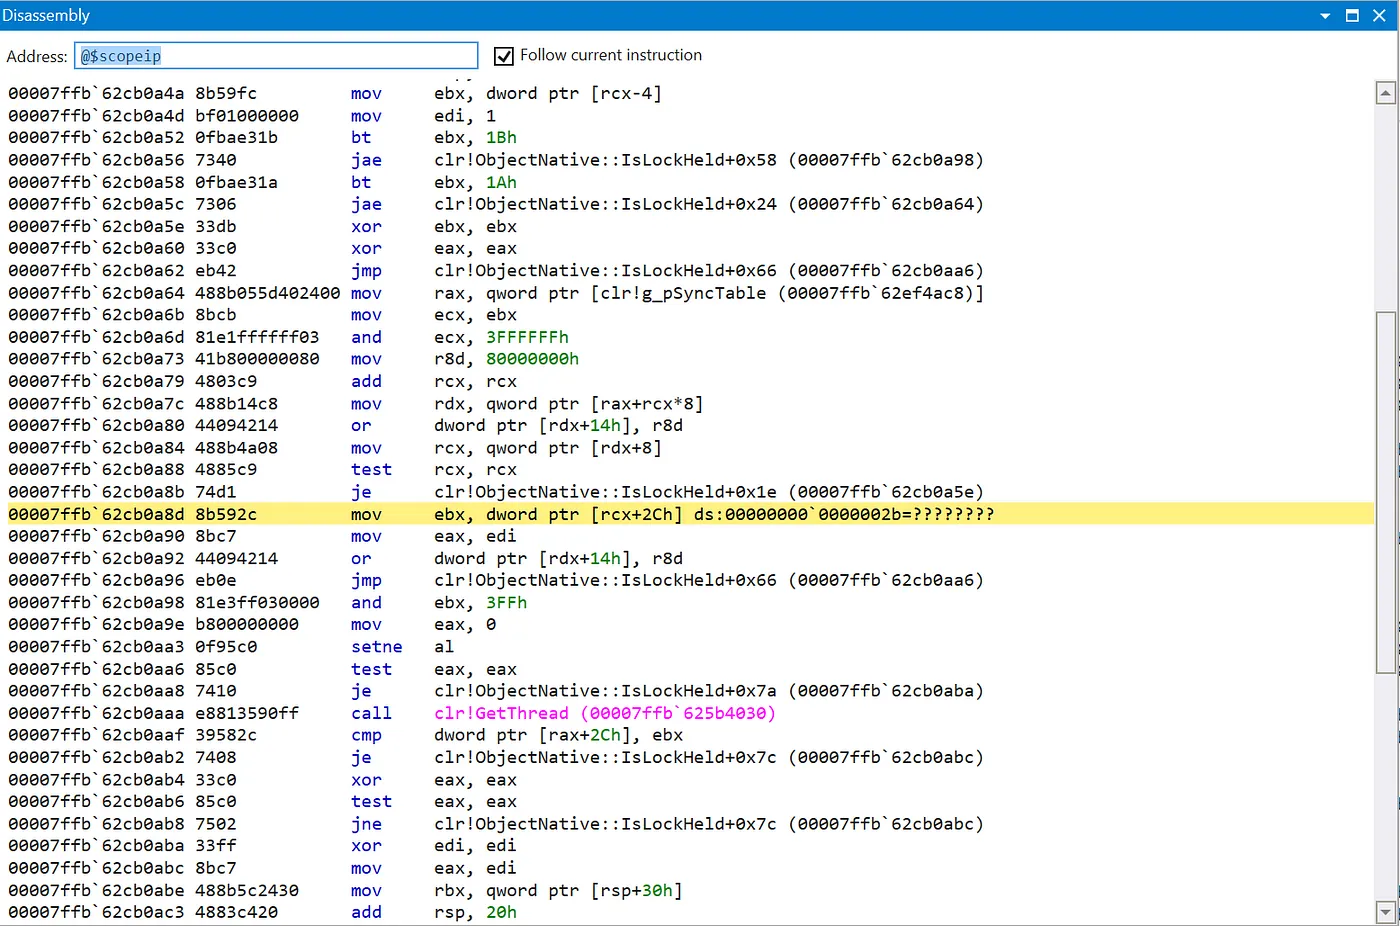
This is the second part of an investigation where I tried to understand why an application was randomly crashing with an
AccessViolationException
. This part starts when, as I ran out of easy things to try, I decided to map the assembly code of the IsLockHeld
method to the original C++ code to understand exactly where it crashed.
Investigating a crash in a .NET application, caused by an AccessViolationException when inspecting the state of a lock.
In this series of article, we’re retracing how I debugged an
InvalidProgramException
, caused by a bug in the Datadog profiler, from a memory dump sent by a customer. This is the last part of the investigation, about figuring out what is wrong with the IL code.