Debugging and fixing the Twitch desktop client
I’ve seen through the years that debugging is often misunderstood. Many people that are unfamiliar with debugging tend to think it’s all about mastering difficult and austere tools. I often had coworkers ask me “what sequence of commands should I type in WinDbg to debug this kind of issue?”, as if debugging was about applying a simple flowchart with a complex tool. This is in fact quite the opposite. Debugging is all about the mindset and the methodology, and the tooling is the simple part. Thinking that debugging is about learning how to use WinDbg is like thinking you can become an investigative journalist by learning how to use a camera. Sure, this will help, but you won’t go very far with just that skill.
Where am I going with all this? A few days ago, I ran into a bug with the Twitch desktop app, and after a few hours and a bit of luck I was able to find the cause and fix it. I thought this would be a nice opportunity to explain the mindset and methodology involved in the debugging of an application you know almost nothing about. To that effect, this article won’t detail the tooling in depth but will retrace as exhaustively as possible the steps I took during the investigation, including the trial and error and false leads.
Enough talk
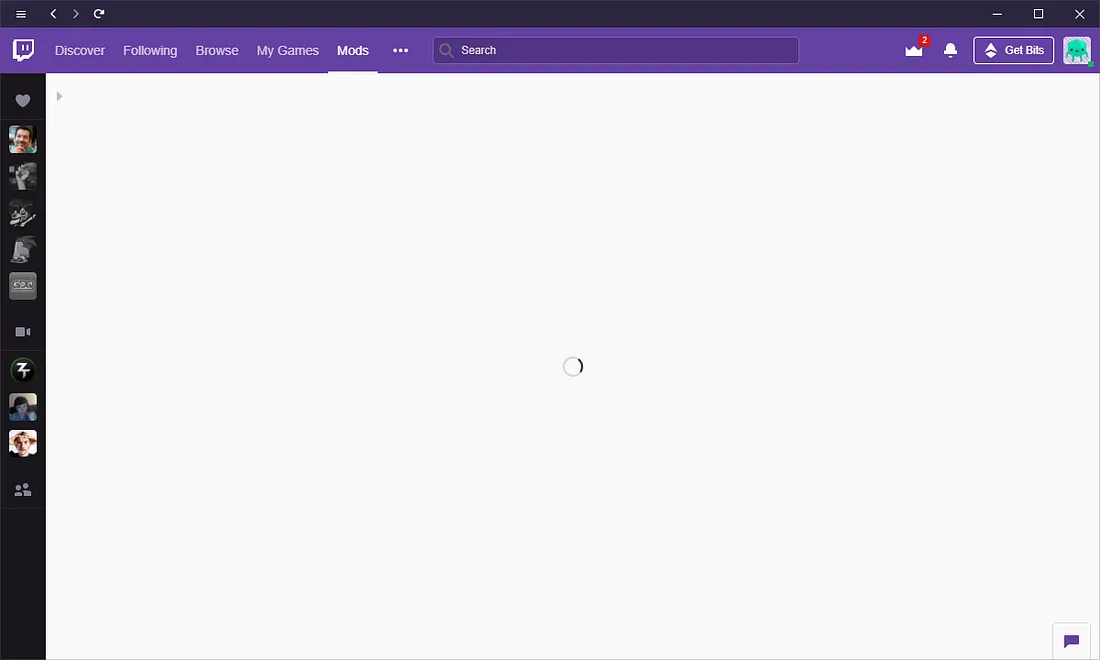
So, what’s the actual bug? When I tried to open the “Mods” tab of the application, the page refused to load, just displaying a loading animation that went on forever:
A quick search on forums revealed that the bug was widespread and had began with an application update in early April. Some users suggested workarounds that looked random, and none of those worked in my case. In the process, I discovered that at least part of the application is written in .NET (cue the TwitchAgent.exe.config file in the application folder). Unable to launch my game, I ended-up de facto with some free time that I decided to spend on debugging.
The first step was to gain more information on the issue itself. I quickly noticed a “logs” folder and started digging into it.
One of the log files, for the TwitchUI process, revealed a lot about what was happening. The interesting sequence of logs was:
[ElectronMain] Launching process (name: TwitchAgent.exe)
[ElectronMain] Connecting to service (name: TwitchAgent.exe)
[ElectronMain] Connecting (route: Twitch-App-Pipe-21572)
[ElectronMain] Creating IPC connection…
[ElectronMain] IPC Connection timed out!
[ElectronMain] Retrying connection.
[ElectronMain] Creating IPC connection…
[ElectronMain] IPC Connection timed out!
[ElectronMain] Retrying connection.
** same thing a few times**
[ElectronMain] No more connection retries. Process will relaunch once closed.
[ElectronMain] Process has closed.
** whole sequence would repeat a few times **
[ElectronMain] Reached attempt limit for process restarts; try to restart or reinstall!
What can we deduce from this? There are two processes involved: TwitchUI and TwitchAgent. TwitchUI spawns a child TwitchAgent, then tries to establish a communication, probably using named pipes (Twitch-App-Pipe-21572). The connection would fail despite the numerous retries.
I tried using Process Explorer to confirm the sequence of events, and indeed I could see the child TwitchAgent process being spawned by TwitchUI, do some work for about 20 seconds, then exit. After 4–5 times, no more TwitchAgent processes were spawned.
Digging into TwitchAgent
At that point, the most obvious possibility was that something wrong was going on with TwitchAgent. Luckily, that process also had logs, and at least one exception was logged:
"message": "Value cannot be null.\r\nParameter name: path1",
    "type": "System.ArgumentNullException",
    "stack": [
      "System.IO.Path.Combine(String,String)",
      "Curse.Radium.Minecraft.Utility.JavaFinder.FindJavas_Win(,
      "Curse.Radium.Minecraft.Utility.JavaFinder.FindJavas(),
      "Curse.Radium.Minecraft.Utility.JavaFinder.Refresh(),
      "Curse.Radium.Minecraft.MinecraftPlugin+<>c.<InitInternal>b__3_2(),
      "Curse.Common.Extensions.TaskEx+<>c__DisplayClass8_0.<TryRun>b__0(),
      "System.Threading.Tasks.Task.InnerInvoke()",
      "System.Threading.Tasks.Task.Execute()"
Was it our culprit? After decompiling the Curse.Radium.Minecraft.Utility.JavaFinder class and looking at the FindJavas_Win method, I isolated the few calls to Path.Combine:
Path.Combine(Environment.GetFolderPath(Environment.SpecialFolder.System), "javaw.exe"),
Path.Combine(Environment.GetFolderPath(Environment.SpecialFolder.SystemX86), "javaw.exe"),
Path.Combine(Path.Combine(MinecraftLauncherManager.Instance.RuntimeFolder, "jre-x64\\bin"), "javaw.exe"),
Path.Combine(Path.Combine(MinecraftLauncherManager.Instance.RuntimeFolder, "jre-x32\\bin"), "javaw.exe")
Since it was unlikely that the Environment.GetFolderPath method would return null, it seemed reasonable to think that MinecraftLauncherManager.Instance.RuntimeFolder was the culprit. To confirm it, I tried attaching a debugger configured to break on first chance exceptions. After breaking into FindJavas_Win, I inspected the value of the property, and sure enough it was null:
How to fix that? The property had a getter but not setter, so no easy way to assign a value from the debugger:
public string RuntimeFolder
{
    get
    {
        return ElectronSettingsManager.Instance.GetSetting<string>(delegate(ElectronSettings s)
        {
            MinecraftSettings minecraftSettings = s.MinecraftSettings;
            if (minecraftSettings == null)
            {
                return null;
            }
            return minecraftSettings.RuntimeRoot;
        }, null, false);
    }
}
I tried tracking back to where the value initially came from, but quickly got lost. Instead, I figured out it would be easier to directly patch the assembly. I used a nifty feature from Jetbrains dotPeek to fully decompile the assembly and generate a csproj, and modified the code of the method to use a hardcoded value instead of the call to Path.Combine. Then I recompiled it and replaced the original assembly with the patched one. After starting the application, the issue was still there. More intriguing, the same exception was logged! Had I missed something?
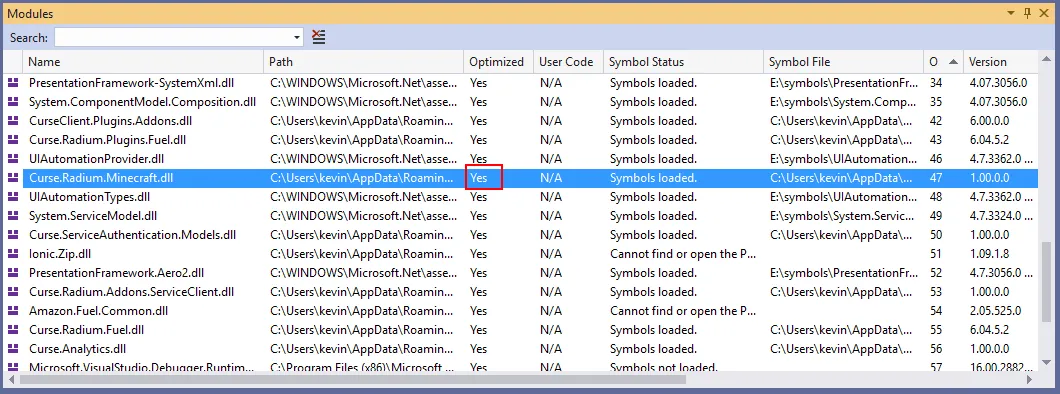
Maybe the application wasn’t loading the right assembly and instead was using some kind of shadow copy. To check that, I reattached the debugger to the process and checked the “Modules” window to make sure the assembly was loaded from the correct path. And it was, so something else was going on.
I then noticed that the module was marked as “Optimized” even though I compiled it in debug mode:
Maybe I actually forgot to copy the file? Checking the modification date, the file was a few weeks old… Silly me!
Making extra sure to copy the right assembly this time, I tried again and… same result. Re-checking the file modification date, I noted it was back to a few weeks ago. Clearly, the application was overwriting it at startup, probably because of the auto-update feature. How to prevent that? I could find the auto-update code and patch it, but I decided it would be simpler to just remove the write permissions from the file. By chance, the auto-updater logged an error when failing to replace the file but wouldn’t prevent the application from starting.
After starting the application with the assembly properly patched, the aforementioned exception was gone. But the “Mods” page still wouldn’t load. I found other exceptions in the logs, more patching to do?
After fixing two more of those exceptions and still seeing no change with the bug, I decided to take a step back. It looked like all those exceptions were caused by uninitialized variables and were just the consequence of using the default settings in the app. They were logged but properly handled in the code, so I probably was on the wrong track.
Following a new lead: IPC
I decided to spend more time analyzing the logs of TwitchAgent, this time ignoring the exceptions. After a while, I noticed this sequence of events:
Connecting to IPC via pipe Twitch-App-Pipe-21572
Attempting Desktop Service connection.
Service connection timed out!
Attempting to reconnect. 2 attempts remaining
Attempting Desktop Service connection.
Service connection timed out!
Attempting to reconnect. 1 attempts remaining
Attempting Desktop Service connection.
Service connection timed out!
No connection retries remaining; performing safe shutdown.
This seemed to match the logs I saw on TwitchUI! It seemed that the inter-process communication was failing for some reason. I suspected earlier that the application was using named pipes, so I started by confirming that in Process Explorer:
Sure enough, there was a named pipe with the naming pattern seen in the logs. Maybe a permission issue? I tried launching the app with administrator rights, but it didn’t change anything. I also cross-checked the logs of the two processes to make sure they were using the same name to connect to the pipe.
I decided to check the code in TwitchAgent responsible for connecting to the pipe to see if I could find an obvious mistake. Unfortunately, the inter-process communication was handled by a native library, TwitchIPC.dll, and decompiling native code is outside of my skill set. Instead, I tried to write two custom console applications that communicated using that library… and it worked perfectly. So the issue wasn’t the library itself, but how the Twitch desktop app was using it. While writing my custom console application, I discovered that the TwitchIPC library had an integrated logger that could be activated by the caller. Seeing this, I decided to patch the TwitchAgent to enable those logs, the same way I did when fixing the exceptions. This allowed me to get the following logs:
9:44:10 PM: Creating server for pipe Twitch-App-Pipe-16688
9:44:10 PM: Twitch-App-Pipe-16688: starting connection.
9:44:10 PM: Twitch-App-Pipe-16688: starting with endpoint: \\.\pipe\Twitch-App-Pipe-16688–0
9:44:10 PM: Twitch-App-Pipe-16688: started successfully
9:44:10 PM: Twitch-App-Pipe-16688: connecting to endpoint \\.\pipe\Twitch-App-Pipe-16688–1
9:44:10 PM: Twitch-App-Pipe-16688: connection finished with status: connectFailed
9:44:10 PM: Twitch-App-Pipe-16688: remote does not exist yet. waiting for incomming connection.
9:44:10 PM: Twitch-App-Pipe-16688: sending message of length: 138
9:44:10 PM: Twitch-App-Pipe-16688: sending message of length: 138
9:44:10 PM: Twitch-App-Pipe-16688: sending message of length: 138
9:44:10 PM: Twitch-App-Pipe-16688: sending message of length: 138
9:44:10 PM: Twitch-App-Pipe-16688: sending message of length: 138
9:44:10 PM: Twitch-App-Pipe-16688: sending message of length: 138
9:44:11 PM: Twitch-App-Pipe-16688: sending message of length: 218
9:44:11 PM: Twitch-App-Pipe-16688: sending message of length: 129
9:44:11 PM: Twitch-App-Pipe-16688: sending message of length: 116
9:44:13 PM: Twitch-App-Pipe-16688: disconnecting
9:44:13 PM: Twitch-App-Pipe-16688: shutting down
What surprised me was how the agent was trying to send data (sending message of length: 138) even though the connection wasn’t properly established (remote does not exist yet. waiting for incoming connection). Maybe there was no buffering in TwitchIPC.dll, and TwitchAgent would send all the data before TwitchUI was ready to receive it? To test this hypothesis, I patched TwitchAgent once more, adding a semaphore to prevent the process from sending the data before the communication was established. But even so, the bug was still there! The logs would stop at remote does not exist yet. waiting for incoming connection, and nothing more would happen. An unexpected side-effect of my semaphore was that it also prevented the process from auto-exiting, since the main thread was blocked on my lock. I used that opportunity to connect my custom console app to the named pipe… And I instantly received all the data! This meant that TwitchAgent was in fact working properly, the issue was on TwitchUI side.
Investigating TwitchUI
From that point, I started digging further in the logs of the TwitchUI process. Another interesting side-effect of my semaphore was helping me to see the moment when TwitchAgent tried to establish the connection: if the CPU usage of the process fell to 0%, it meant that the process was waiting on the lock. Thanks to this, and by watching closely the sequence of logs from TwitchUI during the startup of the application, I finally noticed something peculiar: the TwitchUI process would log Reached attempt limit for process restarts; try to restart or reinstall before TwitchAgent established the connection! I double-checked with the timestamps in the logs to confirm and indeed: TwitchAgent took about 20 seconds to start, but TwitchUI would make 3 connection attempts of 3 seconds each, giving up after 9 seconds in total. The bug was probably that TwitchAgent took longer to start after the update, but the developers didn’t think of adjusting the timeout on TwitchUI side. It also explained the randomness of the workarounds found on the forums, since it was a timing issue.
One final step left
Finding the issue is great, but we still need to fix it. Given that I already had patched a few assemblies used by TwitchAgent, I was confident that I could do the same thing with TwitchUI to adjust the timeout. That’s when I discovered that TwitchUI was an Electron app. DotPeek wouldn’t help me with that one.
Fortunately, by searching “decompile electron app” on Google, I quickly found this article that explained everything I needed to know. It was easy to decompile TwitchUI (or really more “unpack”, since an Electron app is just a Chromium frame running a web page) using a tool named “asar”. Using it, I was able to extract the Javascript code that ran in the process. It was minified, but after pasting it in a beautifier and looking for the IPC Connection timed out message I saw in the logs, I was able to find this code:
this.connectionTimeout = setTimeout(this.onIpcTimeout, 3e3)
That confirmed the 3 seconds timeout I noticed in the logs. After changing the value to 60 seconds and re-launching the app, the bug was gone!
Wrapping it up
I hope this article gave some clues on how to debug an issue when you only have a limited knowledge of the application code. The key is to experiment as much as you can: gather as much information as possible, make a theory about what’s happening (no matter how crazy), and test it. You will very likely be wrong, but in the process you will gain more information, which in turn will help you building a new theory… Until you hopefully manage to understand the issue. Patience is key, and don’t be afraid to fail.


