Dumping the managed heap in C#
A variety of tools exist to check the content of the memory of a .NET process: dotnet-dump, dotnet-gcdump, ClrMD, Visual Studio, and the list goes on. But what if we could do it from within the application itself? If nothing else, this is a great excuse to learn about the layout of the managed heap.
Note: you could already do that using the debugging API, either through ClrMD or the native debugging API. But that’s cheating.
What’s the worse that could happen?
Let’s start with a word of warning. If you started reading this article hoping that you would find some code to run in production, I have bad news. There is no supported way of doing this, and there is no safe way of doing this. While the code in this article mostly works, I have full confidence in its ability to crash your application when you least expect it.
Also this code is specifically built for .NET 8 in 64-bit with server GC (and regions) enabled. As it relies on internal structures, it is likely to break in future versions of .NET.
Fetching the heap
Surprisingly, the hardest part in “dumping the managed heap” is actually finding the heaps. Plural “heaps” because the managed memory is divided in multiple regions: generations 0, 1, 2, large object heaps, pinned object heaps, and non-GC heaps (all plural because there can be many of each). Finding the address of a given object is fairly straightforward:
public static nint GetAddress<T>(T obj)
{
    // Get the address of the reference, cast it to a pointer,
    // then dereference it to get the address of the object
    return (nint)(*(T**)&obj);
}
Fairly straightforward as in “we’re about to dump the managed heap”.
However, we can’t go very far with this. What we need to know is where that region starts and where it ends.
The trick I found is to use the native thread object. I already used it in my “Memory alignment of doubles in C#” article, but here is a quick reminder. The managed Thread object contains an internal _DONT_USE_InternalThread field, which is a pointer to the native Thread object. By knowing its layout in memory, we can use it to retrieve the thread’s allocation context.
static void Main()
{
    ref var nativeThread = ref GetCurrentNativeThread();
    ref var allocContext = ref nativeThread.m_alloc_context;
}

public static unsafe ref NativeThread GetCurrentNativeThread()
{
    return ref Unsafe.AsRef<NativeThread>((void*)GetNativeThread(Thread.CurrentThread));
}

[UnsafeAccessor(UnsafeAccessorKind.Field, Name = "_DONT_USE_InternalThread")]
static extern ref IntPtr GetNativeThread(Thread thread);

[StructLayout(LayoutKind.Explicit)]
unsafe struct NativeThread
{
    [FieldOffset(0)]
    public nint m_stackLocalAllocator;

    [FieldOffset(8)]
    public int m_state;

    [FieldOffset(12)]
    public byte m_fPreemptiveGCDisabled;

    [FieldOffset(16)]
    public nint m_pFrame;

    [FieldOffset(24)]
    public nint m_pDomain;

    [FieldOffset(32)]
    public int m_ThreadId;

    [FieldOffset(40)]
    public nint m_pHead;

    [FieldOffset(48)]
    public LockEntry m_embeddedEntry;

    [FieldOffset(80)]
    public nint m_pBlockingLock;

    [FieldOffset(88)]
    public gc_alloc_context m_alloc_context;

    // Plenty of other fields
}
For brevity sake, the code for most of the structures won’t be published in this article. You can find the full code on GitHub
What is the allocation context? You can think of it as a thread’s personal allowance, some memory that it can quickly allocate without having to talk to the GC. As long as there is enough space left in the allocation context, allocating is just a matter of bumping a pointer. When the allocation context is full, the thread will ask the GC for a new one, which may trigger a garbage collection. Let’s have a look at the allocation context fields:
[StructLayout(LayoutKind.Sequential)]
unsafe struct gc_alloc_context
{
    public nint alloc_ptr;
    public nint alloc_limit;
    public long alloc_bytes;
    public long alloc_bytes_uoh;
    public nint gc_reserved_1;
    public nint gc_reserved_2;
    public int alloc_count;
}
The interesting part is the gc_reserved_1 field. It’s unused with workstation GC, but when server GC is enabled the field stores a pointer to a GCHeap object, representing the heap the thread is allocating to:
inline SVR::GCHeap* get_alloc_heap()
{
    return static_cast<SVR::GCHeap*>(gc_reserved_1);
}
GCHeap contains pretty much only methods, and a single field that points to an instance of gc_heap. Finally, gc_heap contains for each generation an instance of generation. Inside of it, we can find a linked-list of heap_segment, each representing a region in that generation. This is what we were looking for.
We can test it with the following code:
static unsafe void Main()
{
    ref var thread = ref NativeThread.GetCurrentNativeThread();
    var heap = thread.m_alloc_context.gc_reserved_1->pGenGCHeap;

    static void ListRegionsForGeneration(generation gen)
    {
        Console.WriteLine($"Generation {gen.gen_num}");
        var region = gen.start_segment;

        while (region != null)
        {
            Console.WriteLine($" - {(nint)region->mem:x2}, flags: {region->flags}");
            region = region->next;
        }
    }

    ListRegionsForGeneration(heap->generation0);
    ListRegionsForGeneration(heap->generation1);
    ListRegionsForGeneration(heap->generation2);
    ListRegionsForGeneration(heap->generation3);
    ListRegionsForGeneration(heap->generation4);
}
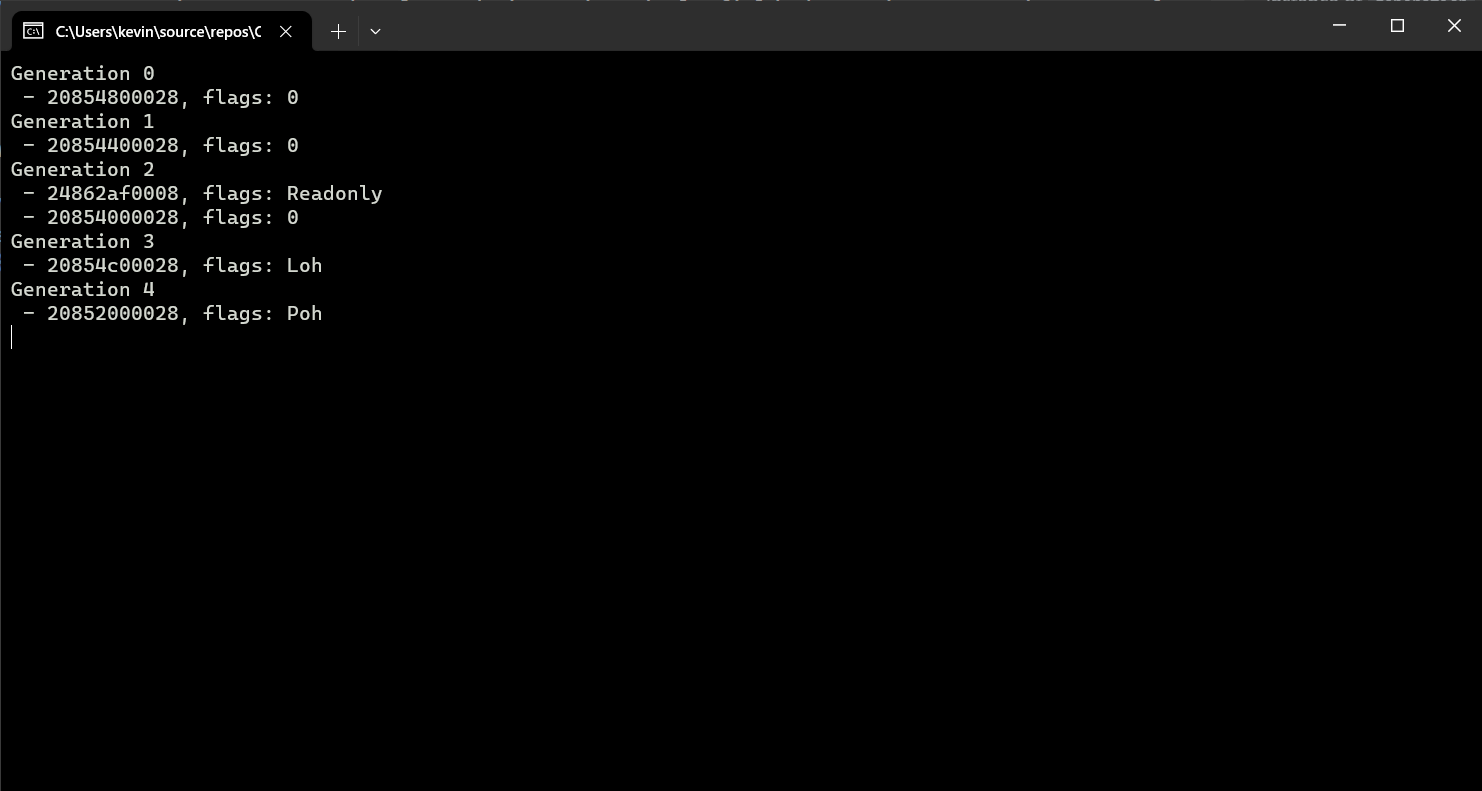
At first glance it looks like it worked. However, the count is not right. We see one region per generation (two for generation 2, but one of them is actually the Non-GC heap). But the application is running with server GC on a 12-core machine, so we should see one region per generation for each heap. The thing is, there is one instance of gc_heap per heap, and we only managed to retrieve the one for the current thread’s heap. And despite my best efforts, I haven’t found a way to jump from an instance of gc_heap to another. Dead end?
Pivoting
Well not quite. So far we’ve retrieved an instance of gc_heap, which only contains information about the current heap, but also an instance of GCHeap that we haven’t really explored yet. As mentioned earlier, it contains a bunch of methods, as part of the IGCHeap interface. It doesn’t look like any of them can be used to retrieve the heaps, but the DiagDescrGenerations method might be the second best thing. It is the foundation of the ICorProfilerInfo2::GetGenerationBounds method, used by profilers to, according to the documentation: “get the memory regions, which are segments of the heap”. This is what we need! The method takes a callback function and calls it for every region in every generation.
Great, so how do we call it from C#? The method is virtual and I have thoroughly explained how to call those in my “Writing a .NET profiler in C#” series. In short, we need to fetch the pointer to the vtable, which is stored in a hidden field at the beginning of the object, then retrieve the address of the method by looking into the right slot of the vtable. The methods are stored in the vtable in the same order as they are declared in the interface, in our case we need to look at the 70th slot.
The signature of the DiagDescrGenerations method is:
virtual void DiagDescrGenerations (gen_walk_fn fn, void *context);
It takes a callback (fn) and an arbitrary pointer to serve as context. Because it’s an instance method, it also has a hidden first parameter that takes the address of the instance. Therefore, the signature of the equivalent function pointer in C# would be delegate* unmanaged<GCHeap*, IntPtr, void*, void>.
The signature of the callback is:
typedef void (* gen_walk_fn)(void* context, int generation, uint8_t* range_start, uint8_t* range_end, uint8_t* range_reserved);
When implementing it in C#, we need to decorate the callback function with the UnmanagedCallersOnly attribute, because it will be invoked directly from native code:
[UnmanagedCallersOnly]
static unsafe void WalkGeneration(void* context, int generation, IntPtr rangeStart, IntPtr rangeEnd, IntPtr rangeReserved)
{
    var size = Math.Round((rangeReserved - rangeStart) / (1024.0 * 1024));
    Console.WriteLine($"WalkGeneration - {generation} - {size} MB - {rangeStart:x2} - {rangeEnd:x2} - {rangeReserved:x2}");
}
We can then cast this callback to a function pointer and give it to DiagDescrGenerations:
ref var thread = ref NativeThread.GetCurrentNativeThread();
var vtablePtr = (nint*)thread.m_alloc_context.gc_reserved_1->vtable;

var diagDescrGenerationsAddr = *(vtablePtr + 69);
var diagDescrGenerations = (delegate* unmanaged<GCHeap*, IntPtr, void*, void>)diagDescrGenerationsAddr;

var walkGeneration = (delegate* unmanaged<void*, int, IntPtr, IntPtr, IntPtr, void>)&WalkGeneration;

diagDescrGenerations(thread.m_alloc_context.gc_reserved_1, (IntPtr)walkGeneration, null);
Rather than using
IntPtrfor the callback, we could make the function pointer strongly typed and declare it as:delegate* unmanaged<GCHeap*, delegate* unmanaged<void*, int, IntPtr, IntPtr, IntPtr, void>, void*, void>But I feel like it just makes it even more confusing.
When running our code, we can see that this time we get a lot more regions:
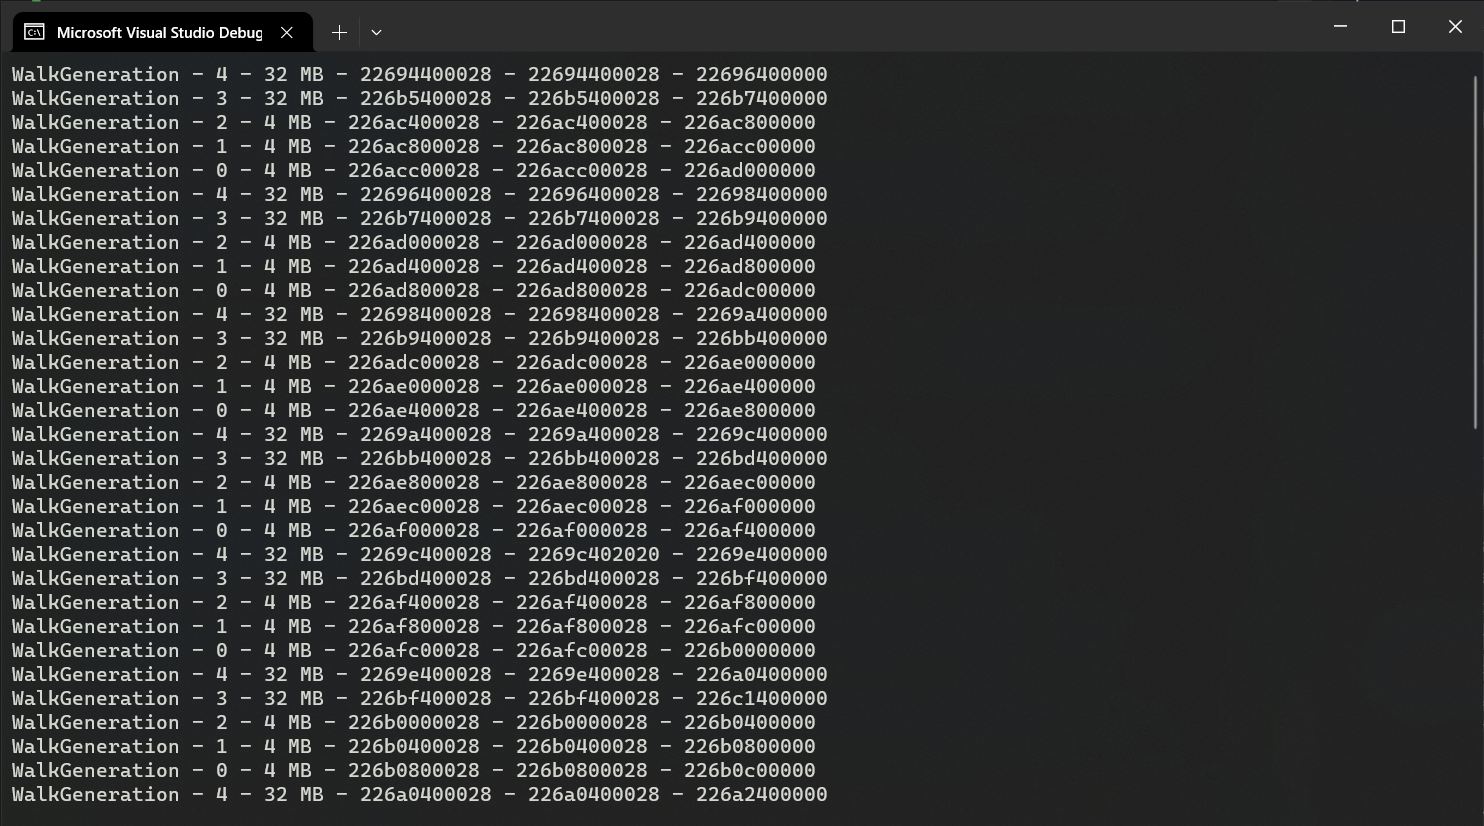
They don’t all fit in the screenshot, but there is a total of 60 regions. That makes 5 regions for each of the 12 heaps, which is roughly what is expected (gen 0, 1, 2, LOH, POH). The non-GC heap is missing, we’ll circle back to it later.
For each of the region, rangeStart is the beginning of the region, rangeEnd the end of the allocated range (containing live objects), and rangeReserved the actual end of the region.
Walking the heaps
Now that we have the list of regions, we can get to the meat of the article: walking the heaps. To do so, there are a few principles to know: the beginning of the allocated part of the region points to the method-table pointer of the first object. The method-table tells us the size of the object. The next object will be located immediately after the first one, and so on. There is no “gap” strictly speaking in the memory: if there’s an area without any object, the GC allocates a dummy “empty” object at the beginning of the area. So the whole allocated area is a tightly packed list of objects, some of them being special “free” objects.
To read the method-table, we don’t have to manually convert the C++ structure to C# like we did for all the GC structures. This time we can directly copy/paste the private MethodTable structure from the BCL (used to implement many helper functions, such as Array.Copy). Then, for a given address, we just read the value at that address (the method-table pointer), reinterpret it as MethodTable*, and dereference it:
public static unsafe ref MethodTable ReadMethodTable(nint* address) => ref *(MethodTable*)*address;
With the method-table in hand, we still need to compute the size of the object. There are two possible scenarios: “classic” objects, and variable-size objects (arrays, strings). For the former, we just need to read the value of the BaseSize field of the method-table. For the latter, we also need to read the length of the array, and multiply it by the size of the individual elements (ComponentSize). The special “Free” object mentioned earlier works like an array.
public static unsafe int ComputeSize(nint* address)
{
    ref var methodTable = ref ReadMethodTable(address);

    if (Unsafe.IsNullRef(ref methodTable))
    {
        return 0;
    }

    if (!methodTable.HasComponentSize)
    {
        // Fixed-size object
        return methodTable.BaseSize;
    }

    // Variable-size object
    // The length is stored right after the method-table pointer
    var length = *(int*)((nint)address + sizeof(nint));
    var size = methodTable.ComponentSize;

    return methodTable.BaseSize + length * size;
}
Note the null-ref check on the method-table. More on this later.
Now we can put everything together and write a function to walk the heap:
public static unsafe void WalkHeap(IntPtr heap, IntPtr limit, void* context)
{
    var mem = heap;

    while (mem < limit)
    {
        var mt = (nint*)mem;

        var size = ComputeSize(mt);

        if (size == 0)
        {
            // We couldn't find the next object, give up
            break;
        }

        // Do whatever you want with the object
        WalkObject(mt, size, context);

        var alignment = sizeof(nint) - 1;
        mem += (size + alignment) & ~alignment;
    }
}
Compared to everything we’ve done so far, this is surprisingly simple. We start at the beginning of the region, and for each object, we compute its size to know where to find the next one. One subtlety is the alignment: each object is aligned, so depending on the size of the previous object, we may need to skip a few extra bytes to reach the next one. The actual alignment depends on the heap: it’s the pointer size for most regions, but it’s 8 bytes for the large object heap. Since this code is written for a 64-bit process, we don’t have to worry about that and always align on 8 bytes (sizeof(nint)).
!dumpheap -stat
Let’s use our new function to implement a simplified version of the !dumpheap -stat command from WinDbg. This command lists the types of objects in the heap, along with the number of instances and the total size. We’ll use a dictionary to store the information.
Walking the heap without suspending the runtime is extremely unsafe, but we can somewhat mitigate the risk by calling GC.TryStartNoGCRegion, effectively disabling the GC for a short period of time.
GC.TryStartNoGCRegion takes a budget, and a GC won’t be triggered until that amount of memory is allocated. We’ll arbitrarily set that budget to 200MB. To make sure we don’t exceed the budget, we call GC.RegisterNoGCRegionCallback to be notified when 150MB have been allocated, in which case we just throw an exception to crash the application. You could get fancy and try to implement some kind of synchronization mechanism to abort the walk, but for my tests I prefer a good old crash.
The dictionary is pre-allocated with a large size, to minimize the risk of allocating more memory during the walk (which could make us exceed the TryStartNoGCRegion budget). To pass the dictionary as the context argument, we have to take its address. In theory, since we are in a no-gc region, the GC shouldn’t move the dictionary until we’re done. Still, just to be extra safe, we wrap it in a struct (which will effectively never move).
private static unsafe void DumpHeapStat()
{
    // Preallocate the dictionary with a large size, to reduce the number of potential allocations in the no-gc region
    var stats = new Dictionary<nint, (ulong count, ulong totalSize)>(1000);

    GC.TryStartNoGCRegion(200 * 1024 * 1024);
    GC.RegisterNoGCRegionCallback(150 * 1024 * 1024, () => throw new OutOfMemoryException("Interrupted by GC :( "));

    ref var thread = ref NativeThread.GetCurrentNativeThread();
    var heap = thread.m_alloc_context.gc_reserved_1;

    var vtablePtr = (nint*)heap->vtable;

    var diagDescrGenerationsAddr = *(vtablePtr + 69);
    var diagDescrGenerations = (delegate* unmanaged<GCHeap*, delegate* unmanaged<void*, int, IntPtr, IntPtr, IntPtr, void>, void*, void>)diagDescrGenerationsAddr;

    var walkGeneration = (delegate* unmanaged<void*, int, IntPtr, IntPtr, IntPtr, void>)&WalkGeneration;

    var context = ValueTuple.Create(stats);

    diagDescrGenerations(heap, walkGeneration, &context);

    GC.EndNoGCRegion();

    DisplayStats(stats);
}
We can now implement the WalkObject function that we call from WalkHeap:
private static unsafe void WalkObject(nint* obj, int size, void* context)
{
    var stats = (*(ValueTuple<Dictionary<nint, (ulong count, ulong totalSize)>>*)context).Item1;

    ref var value = ref CollectionsMarshal.GetValueRefOrAddDefault(stats, *obj, out _);

    value.count += 1;
    value.totalSize += (ulong)size;
}
Note how we store the address of the MT, rather than the type name, in the dictionary. Getting the type name could require some allocations, so we’ll do that when we leave the no-gc region.
Last but not least, we implement the DisplayStats function to display the content of the dictionary in a !dumpheap -stat fashion. To get the name of the type, we create a RuntimeTypeHandle from the address of the method-table, and use it to create an instance of Type using Type.GetTypeFromHandle. This doesn’t work for the special “Free” object which has a fake method-table. There is no special flag to identify that object (the CLR knows its address and uses that information to know if a given method-table pointer belongs to a “Free” object), so we have to come up with some kind of heuristic. After some trial-and-error I found the “has a variable size and no parent” condition, which should only be verified for the “Free” object (even arrays have a parent).
private static unsafe void DisplayStats(Dictionary<nint, (ulong count, ulong totalSize)> stats)
{
Console.WriteLine($" MT Count TotalSize Class Name");
ulong totalCount = 0;
ulong totalSize = 0;
foreach (var (key, value) in stats.OrderBy(kvp => kvp.Value.totalSize))
{
var mt = ReadMethodTable(&key);
string typeName;
if (mt.HasComponentSize && mt.ParentMethodTable == null)
{
typeName = "Free";
}
else
{
var type = Type.GetTypeFromHandle(RuntimeTypeHandle.FromIntPtr(key))!;
typeName = type.FullName!;
}
totalCount += value.count;
totalSize += value.totalSize;
Console.WriteLine($"{key,12:x2} {value.count,8} {value.totalSize,12} {typeName}");
}
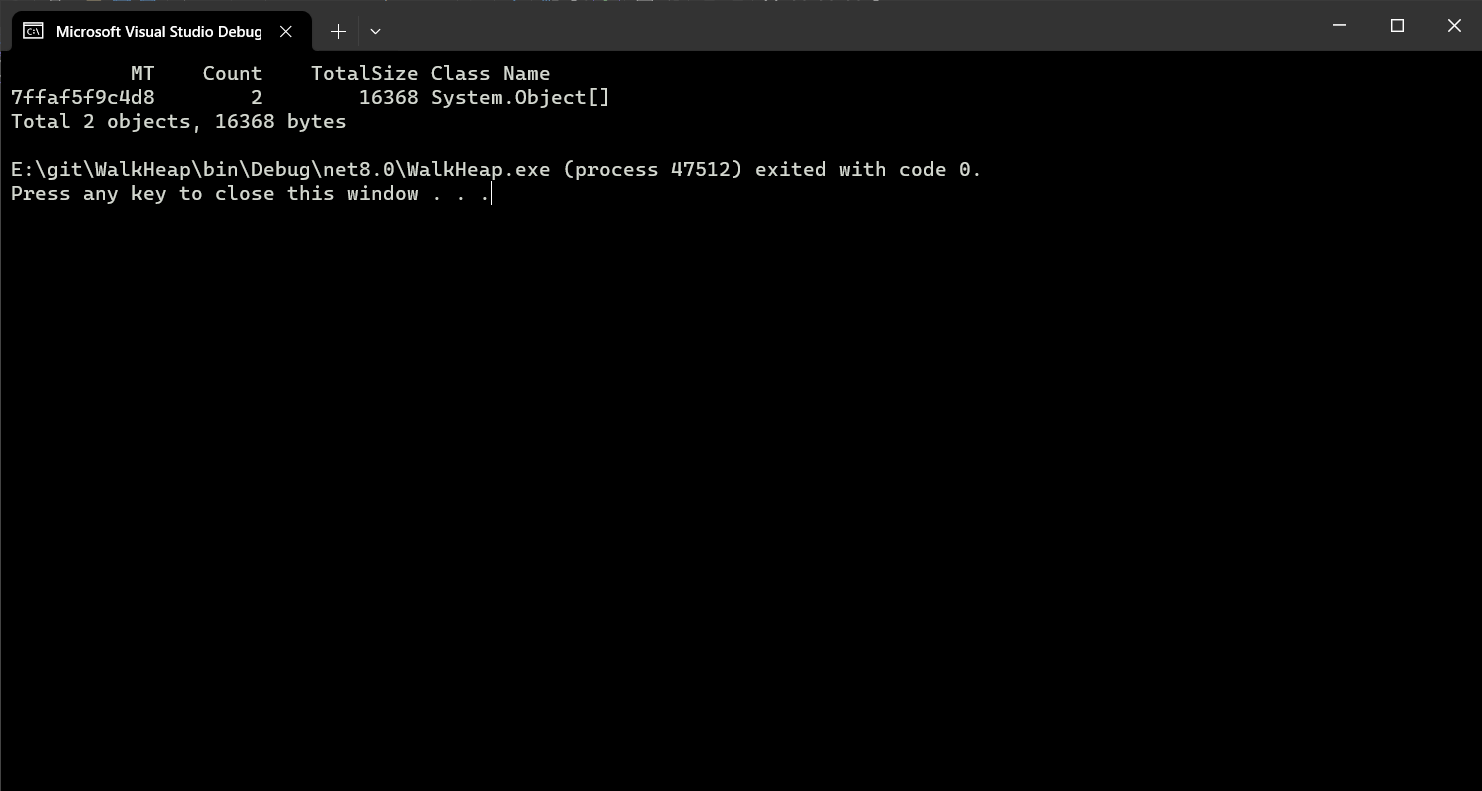
Console.WriteLine($"Total {totalCount} objects, {totalSize} bytes");
}
If we run the code, we can see that it finds almost nothing. What’s going on?
The allocation contexts
Remember when I mentioned the allocation contexts? The threads’ “personal allowance” that they can use to allocate objects without talking to the GC? The problem is that, until the next garbage collection (during which the allocation contexts will be “consolidated”), they are mostly outside of the “allocated” range of the regions (I say “mostly” because the subject gets very complicated very quickly). So we’re walking the heap, but we’re missing most of the generation 0 objects, which will only become visible after a garbage collection. And since the application was just started, most of the objects are in generation 0. To mitigate this, we can simply force a garbage collection before walking the heap.
private static unsafe void DumpHeapStat()
{
    // Preallocate the dictionary with a large size, to reduce the number of potential allocations in the no-gc region
    var stats = new Dictionary<nint, (ulong count, ulong totalSize)>(1000);

    // Force a GC to minimize the amount of memory dangling in the allocation contexts
    GC.Collect(2, GCCollectionMode.Forced, true, true);

    // ...
}
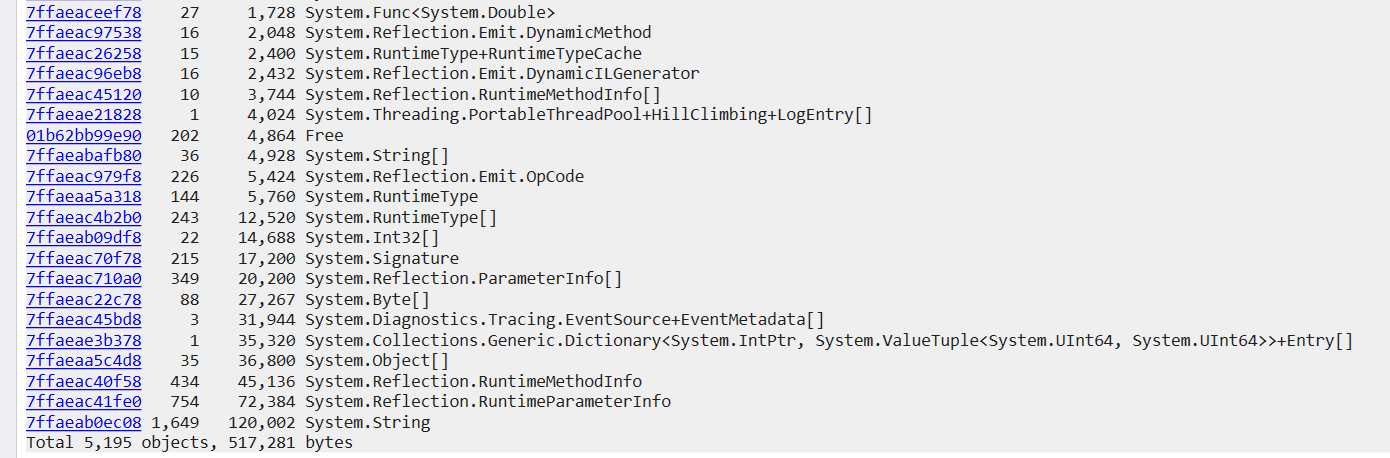
Now we find a lot more objects:
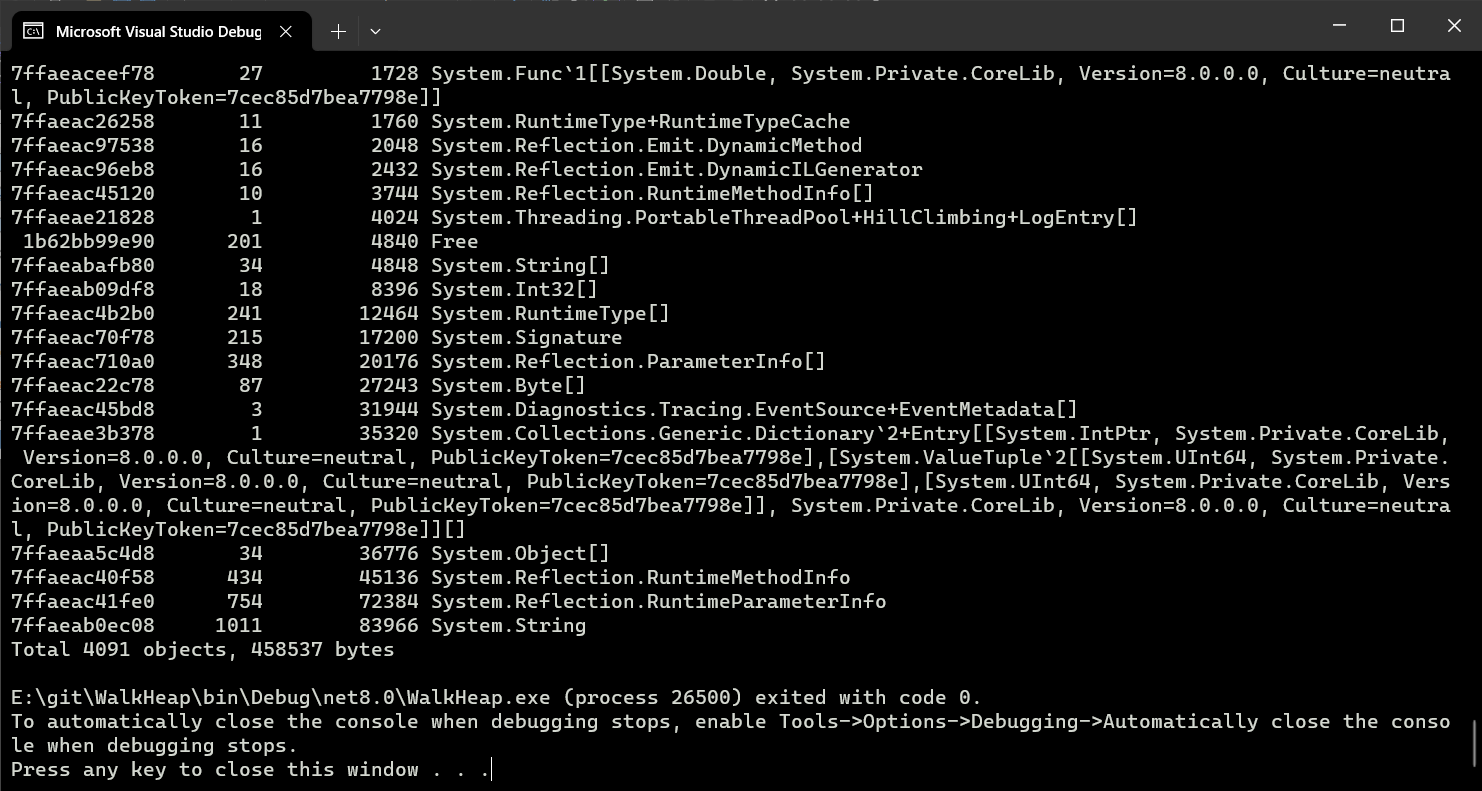
Still, if we compare to the output of the !dumpheap -stat command in Windbg, we can see that we’re still missing many objects, mostly strings:
That’s because, as mentioned earlier, DiagDescrGenerations does not list the regions from the non-GC heap. Can we find another way to retrieve them?
The non-GC heap
The non-GC heap is a special heap that contains objects that are not managed by the GC. It’s mostly used by the runtime, the only way for users to allocate in it is to use frozen segments, as described in one of my previous articles.
At the end of that article, I explained that GC._RegisterFrozenSegment returns a pointer to an instance of heap_segment. I know the current article is starting to be a bit long, but we mentioned heap_segment early on, and it’s the linked-list that we used in the first prototype to list the regions in one of the GC heaps. The heap_segment returned by GC._RegisterFrozenSegment works the same way, except that it’s linked to the other non-GC regions. So all we have to do is to register our own frozen segment, then use the instance of heap_segment to find the others:
private static unsafe void WalkNGCH(void* context)
{
    var segment = RegisterFrozenSegment((IntPtr)0x0, 0);

    var heapSegment = *(heap_segment*)segment;

    var next = heapSegment.next;

    while (next != null)
    {
        if (next->flags == heap_segment.RegionFlags.Readonly)
        {
            WalkHeap((nint)next->mem, next->allocated, context);
        }

        next = next->next;
    }

    UnregisterFrozenSegment(segment);
}
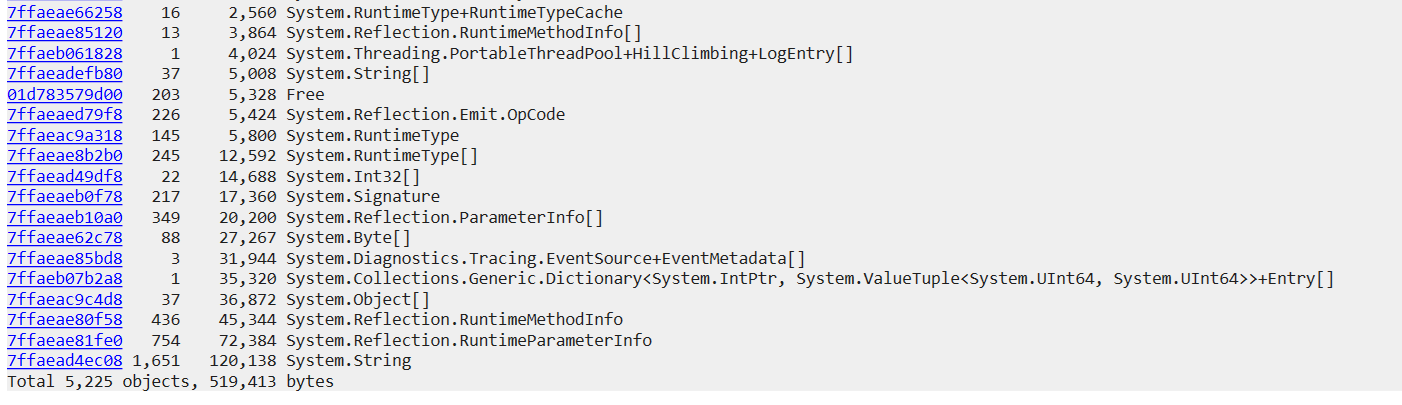
What we get now…
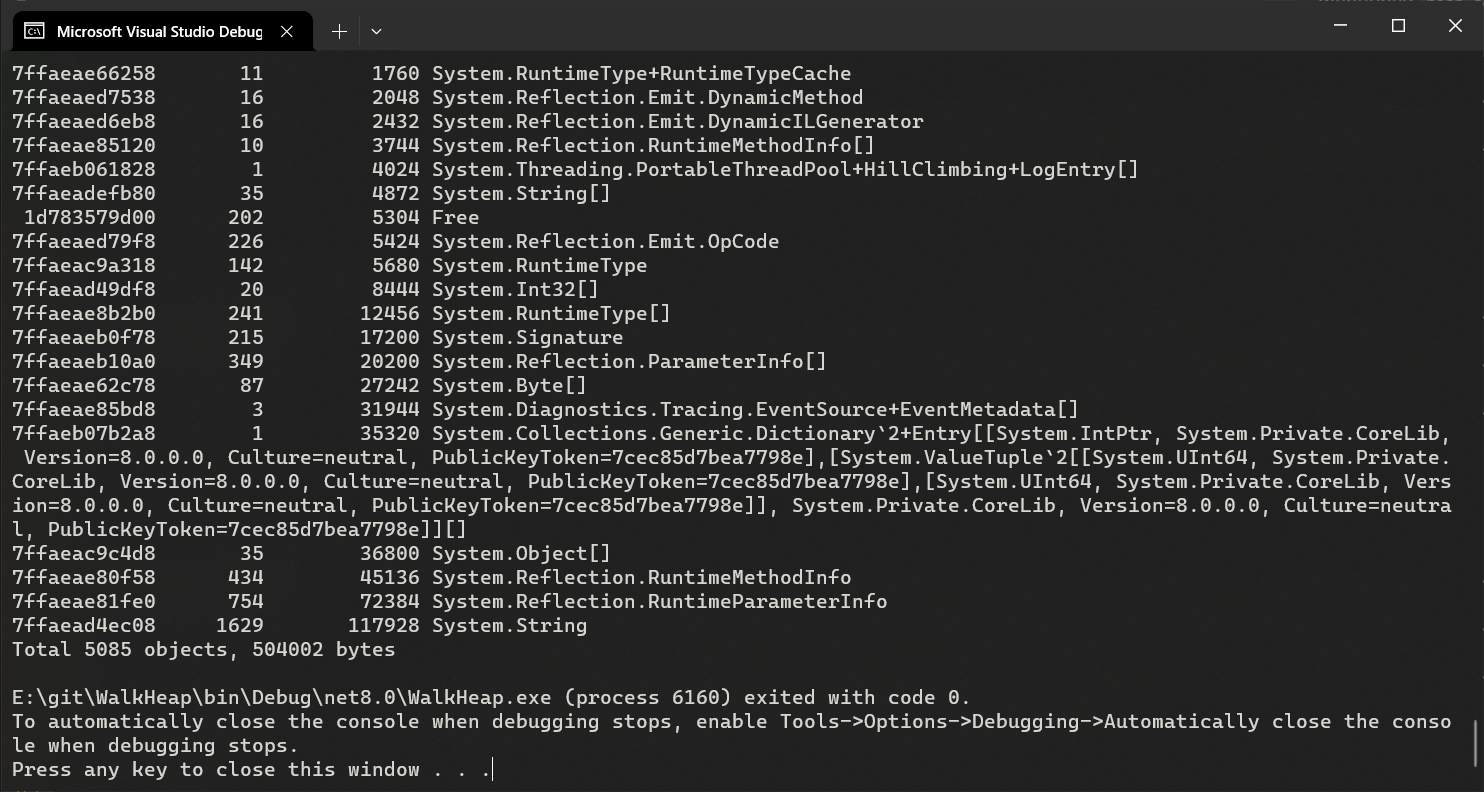
… is very close from what we get with !dumpheap -stat:
Safety
As mentioned at the beginning of the article, this code is not safe. One issue is that you could end up walking an allocation context (yes, I said they’re mostly outside of the allocated range, but mostly is the key here). This is a problem because they end with a chunk of free space that is not marked by a “Free” object. I’ve mitigated this risk by adding the null-ref check in ComputeSize and bailing out. But at the end of the day, even though we suspended the GC, we’re still walking the heap while other threads are allocating memory, and we could end up observing objects in an invalid state. One major shortcoming of doing unsafe programming in C# is that .NET does not allow to catch AccessViolationException. If we poke the wrong memory location at the wrong time, the application will crash.
I’ve spent some time trying to find a hack to catch AccessViolationException, but with no success so far. <legacyCorruptedStateExceptionsPolicy> might still work in .NET Core (I haven’t tried it) but it’s a global solution to a local problem so I’m not satisfied with it. The local version of this setting, the HandleProcessCorruptedStateExceptions attribute, is deprecated and has no effect on .NET Core.
That said, I’ve tried stress-testing my code by invoking it repeatedly while other threads allocate in the background, and the only issue I’ve found is an unrelated memory leak in GC.TryStartNoGCRegion. Still, I definitely wouldn’t run this code in production.
One more thing
If you are very familiar with .NET diagnostics, you may be wondering if it’s possible to retrieve the list of regions using an event source, instead of the hack that I’m relying on. The answer is “yes, but”. Unless I’m forgetting some, there are only two events that could be interesting for that purpose: GCCreateSegment_V1 and GCGenerationRange.
GCCreateSegment_V1 has two problems. First, it’s raised when the region is created (the terms “segment” and “region” are used interchangeably when speaking about the GC), so the question is how to discover the regions that were created before the event source was enabled. When the IGCHeap::DiagTraceGCSegments method is invoked, the event is re-raised for all regions, so there might be a way to make it happen. However, even if we managed to, GCCreateSegment_V1 only provides the address and the size of the region, not the allocated range. This information is mandatory to walk the heap properly.
GCGenerationRange has all the information we need, but it’s only raised at the beginning and end of a GC. This is a problem because we need to do our scan inside of TryStartNoGCRegion to ensure that the list of regions doesn’t change. So we have two possible scenarios:
- If we trigger a GC, then call
TryStartNoGCRegion, there is a window of time between the two where another GC could be triggered (theGCGenerationRangeevent is received asynchronously), invalidating our list of regions. In fact,TryStartNoGCRegionitself triggers a GC internally. - If we call
TryStartNoGCRegion, then trigger a GC, we will automatically leave the no-GC region, so we’re back to the previous scenario.
You may be wondering: if
TryStartNoGCRegiontriggers a GC, why do we need to trigger one ourselves? Well, for some reason, the GC triggered byTryStartNoGCRegiondoes not send theGCGenerationRangeevent. That’s really unlucky.
Conclusion
We’ve seen in this article how to walk the managed heap. The GC and most debugging tools use the same logic: each object start at the end of the previous one, and free spaces are considered as dummy objects. Allocation contexts require a special treatment, and for instance ClrMD uses the debugging API to retrieve them and walk past their unused space.
While the code presented here is mostly useless, I always find it thrilling to see how far you can go by abusing some APIs and putting your nose where it doesn’t belong. It’s a great way to improve your understanding of the internal mechanisms and data structures of the CLR.