GummyCat - Visualize the activity of the .NET garbage collector
I’m happy to announce the availability of a new tool to visualize the activity of the .NET garbage collector: GummyCat.
It presents the memory layout of the .NET heap, showing what regions of memory have been reserved by the garbage collector and for what purpose.
It was initially meant to be just some eye candy for my “What’s new in .NET memory management?” talk at Update Conference 2023 with Christophe Nasarre. However, I quickly realized how useful it was to understand how regions are managed by the garbage collector, and started using it to further my understanding of the .NET memory management. It eventually evolved into a full-fledged tool that I’m happy to share with the community.
Where to get it?
GummyCat is available as a dotnet tool, and can be installed using the following command:
dotnet tool install -g GummyCat
Once installed, you can run it with the following command:
gummycat
If you’re feeling fancy, you can also check the source code on the GitHub repository and build it yourself.
I’ve only tested it on Windows, but the application was written with Avalonia UI, so in theory it should work on Linux as well.
Walkthrough
GummyCat has been designed to work with .NET 7+ applications, with regions enabled. While there is code to handle ephemeral segments from older versions of .NET, I didn’t spend as much effort on it and it’s likely that I’ll remove it in the future.
When launching the application you are greeted with a menu asking you to pick your target. Two types of targets are currently supported: live processes and memory dumps.
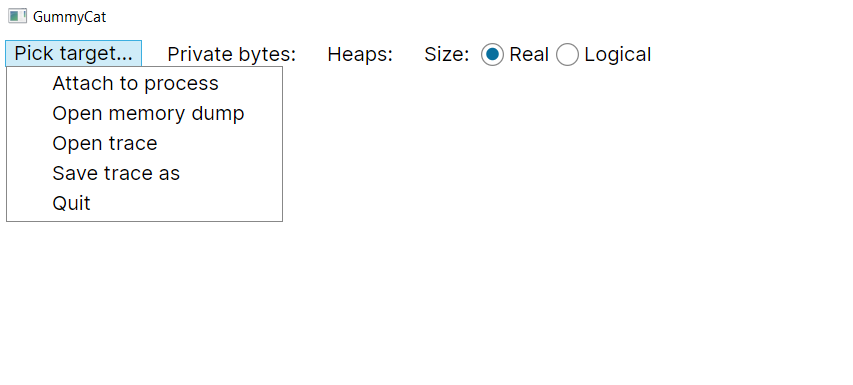
As this tool was initially designed for demo or educative purposes, you’ll also find the “Save trace as”/“Open trace” options that respectively allow you to save a session and restore it.
When clicking “Attach to process”, you’ll be presented with a list of running .NET processes. The most recent processes are listed first.
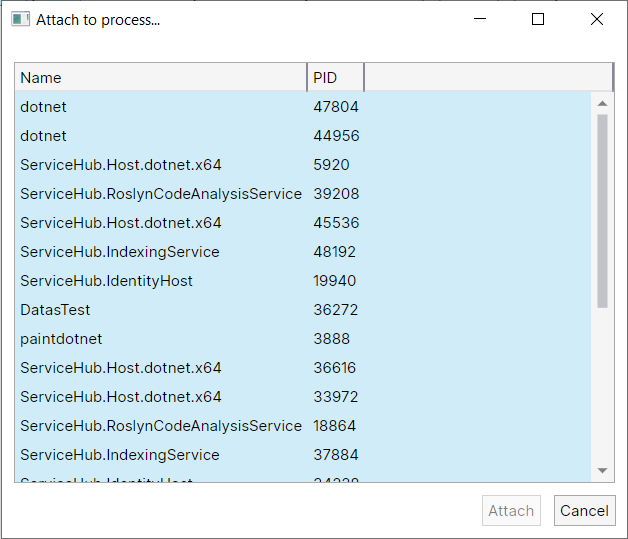
Attaching to a process is intrusive and will briefly pause the application after each garbage collection. I would not recommend doing it on a production application.
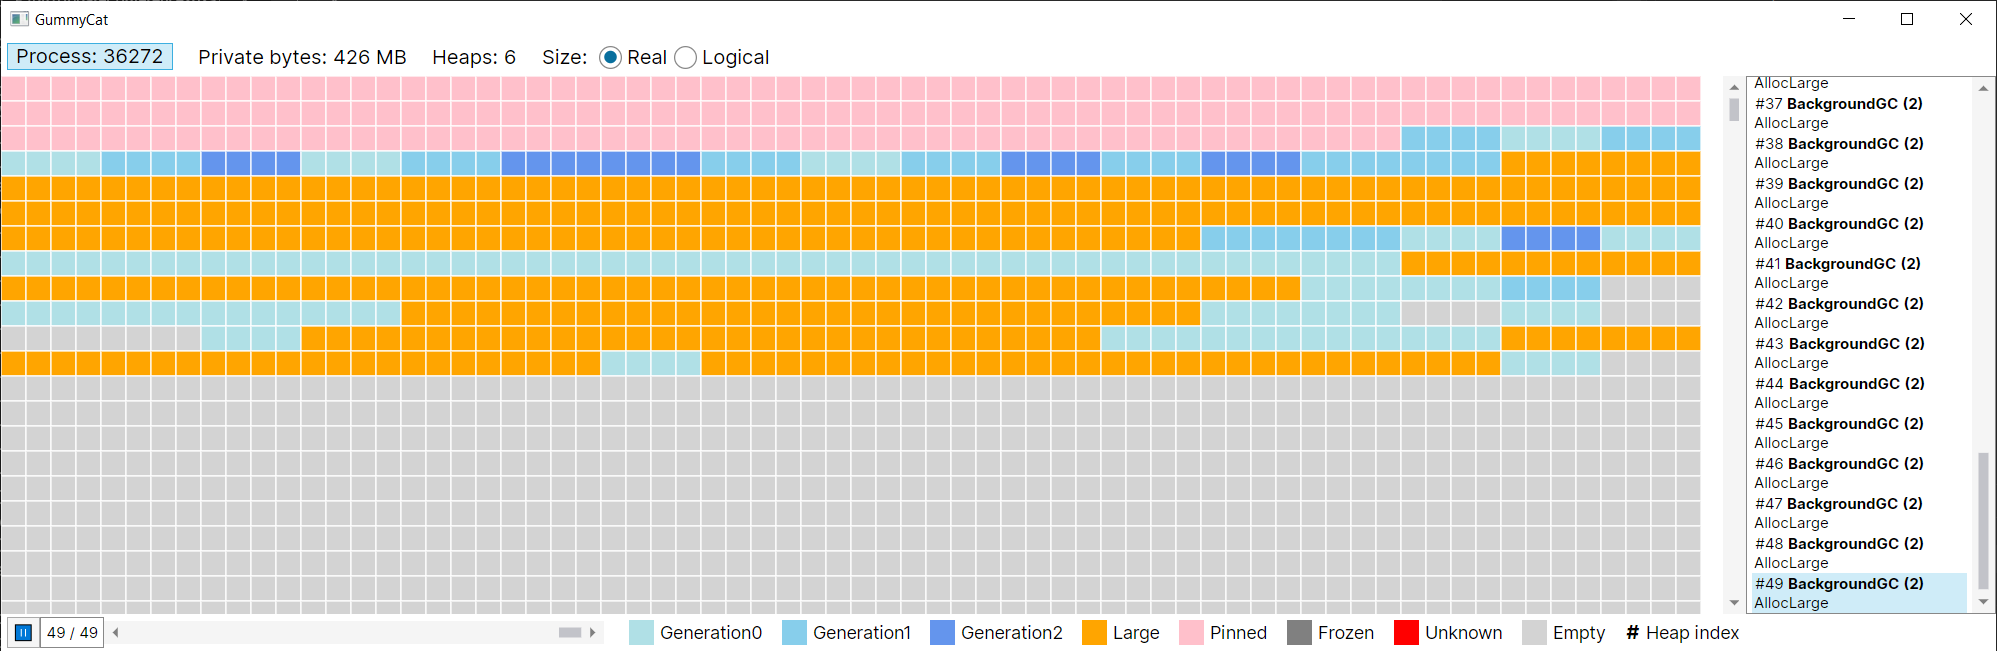
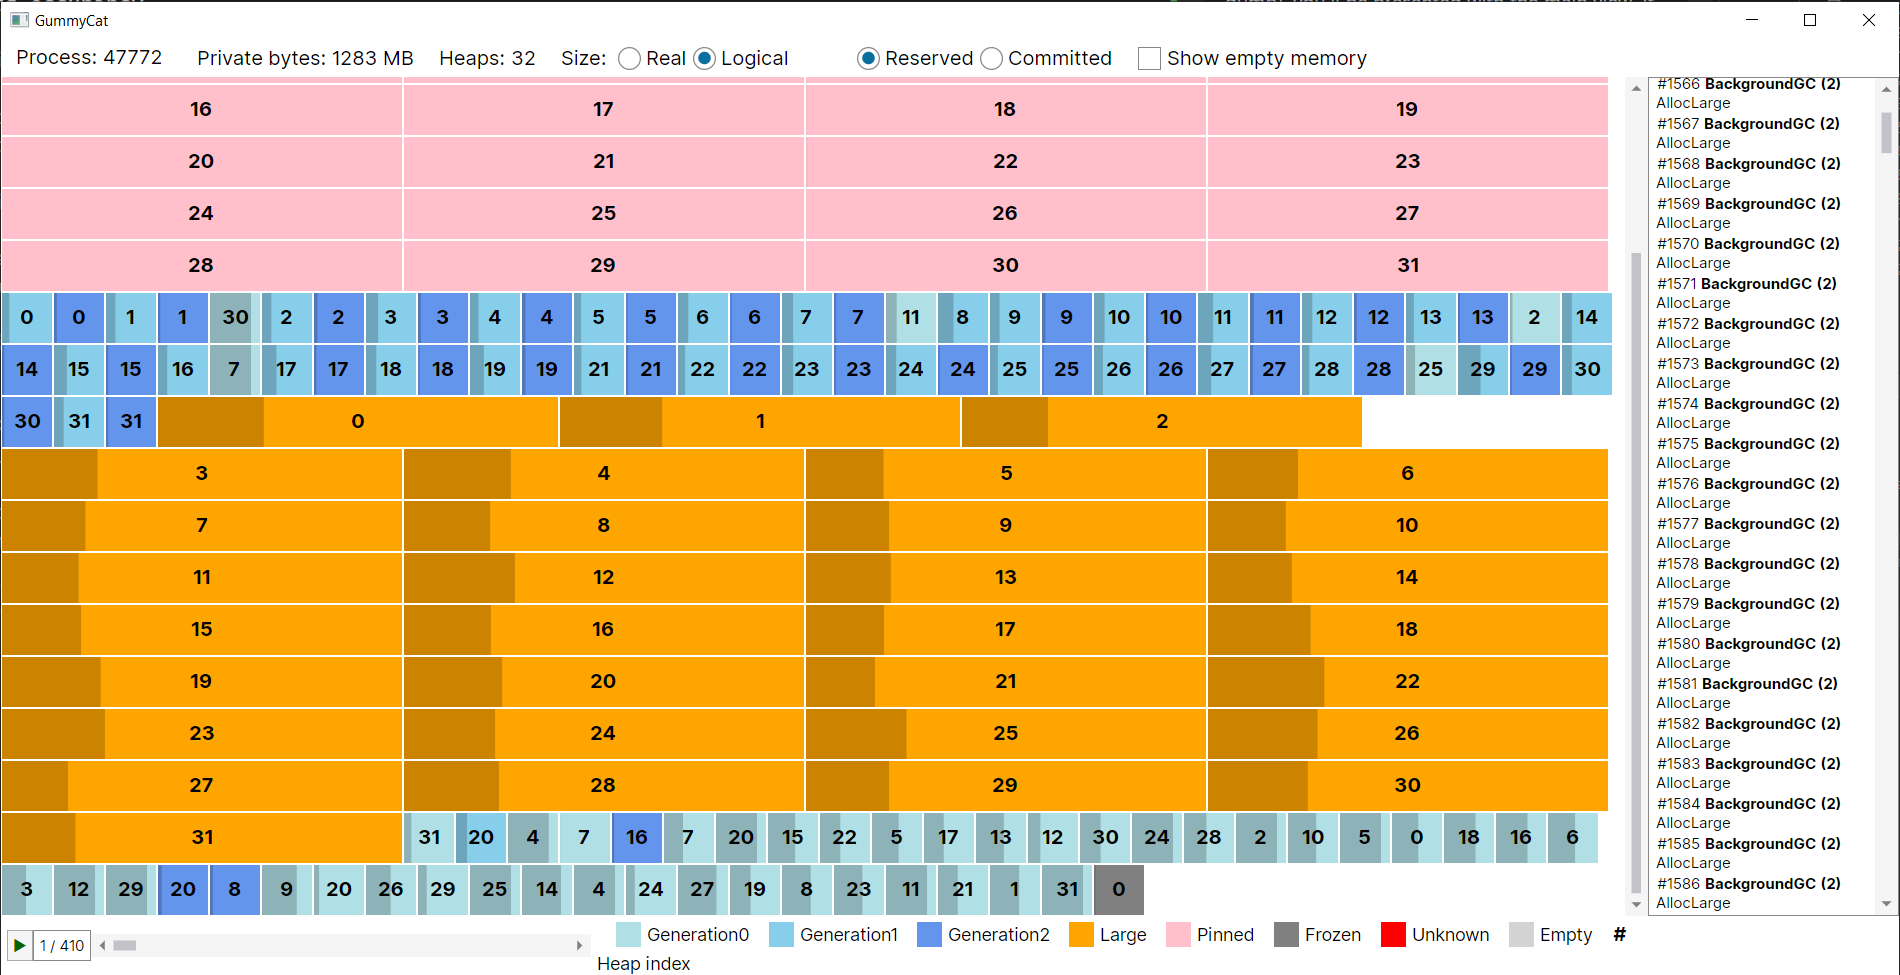
After attaching to a process (or opening a memory dump), you’ll be presented with the main view. It should be fairly obvious at this point that I was aiming for a defrag tool aesthetic.
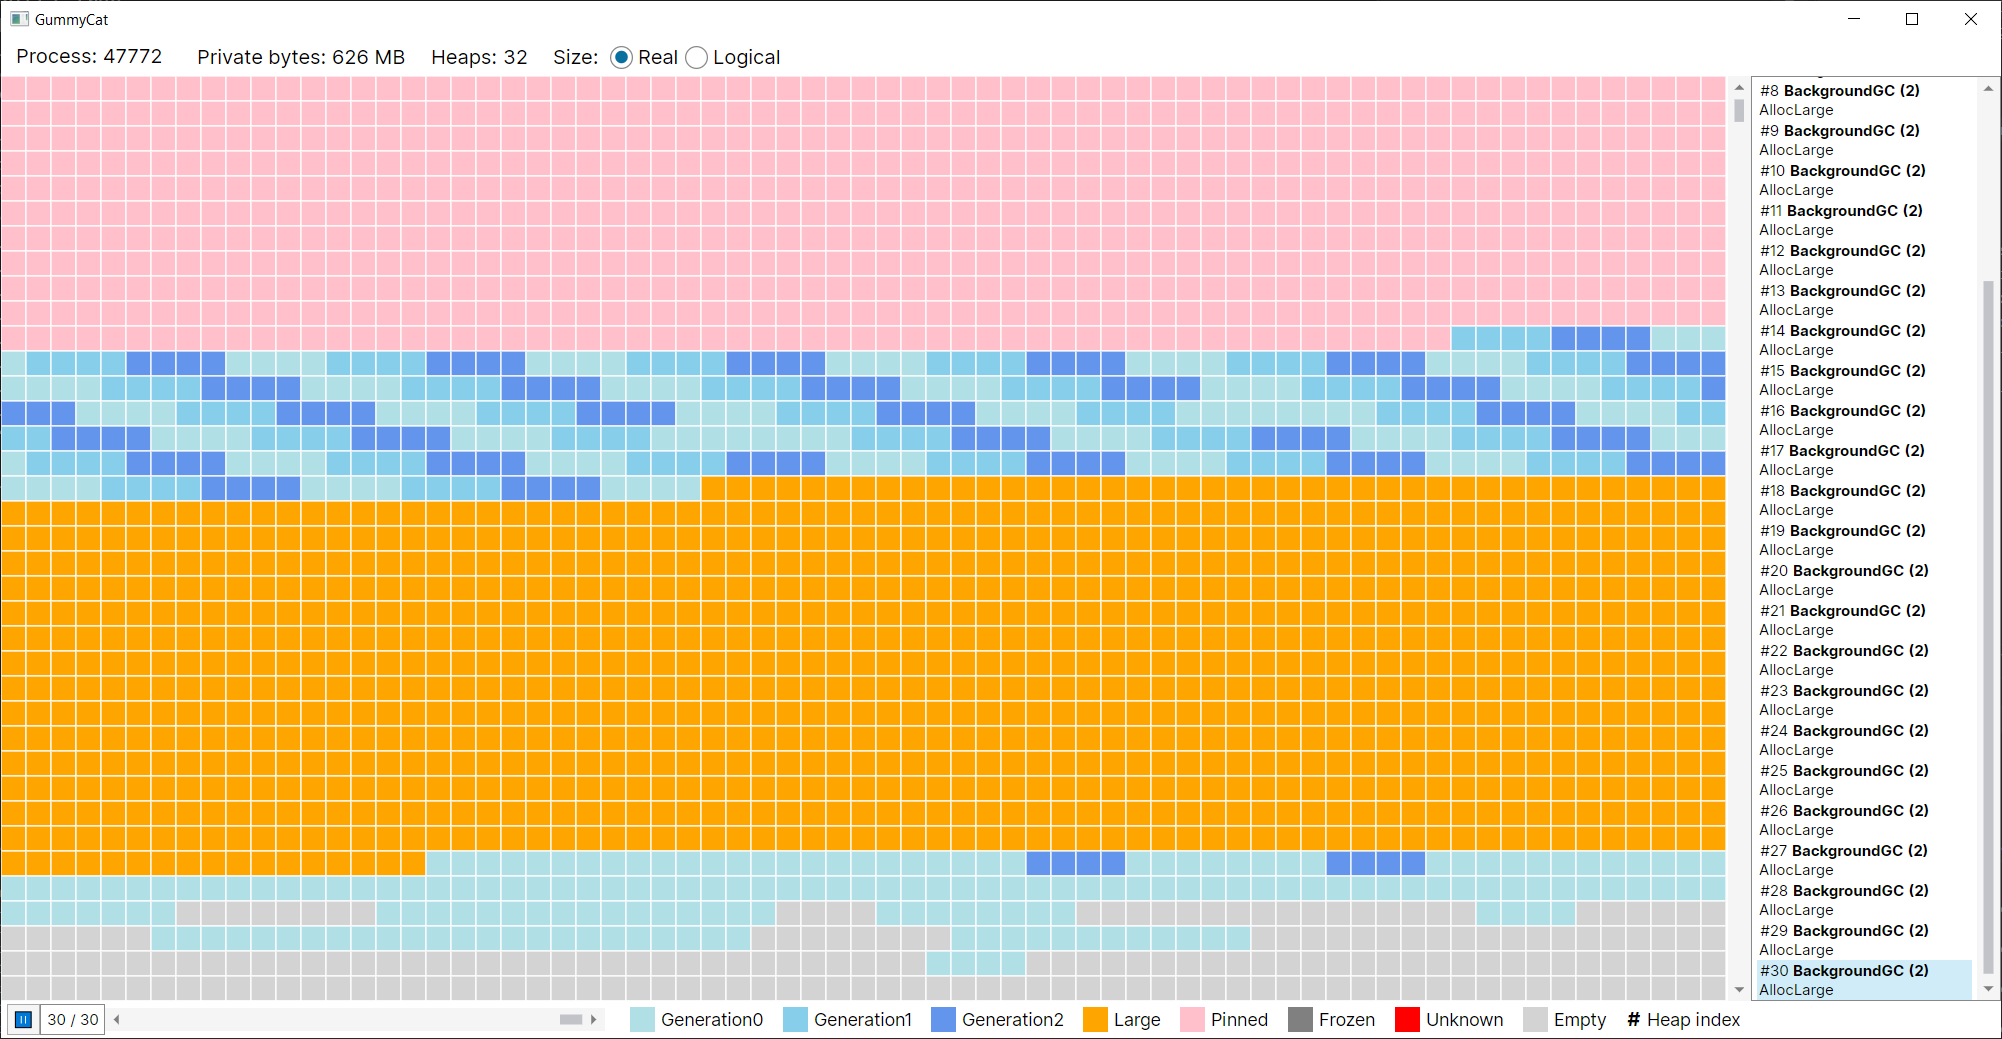
The main view shows how the heap is organized, with each GC region color coded. Each square represents 1 MB of memory. One important thing to note is that it shows the memory that is reserved by the GC, not the memory that is actually used. For instance, basic regions are always 4 MB, but it doesn’t mean that this space is filled. The view tends to extend down a lot because the non-GC heap (NGCH) is allocated much higher in the memory space. I’ll probably collapse long free spaces in the future, once I find a visual representation that I like. When hovering over a region, the small number indicates the index of the heap it’s associated to. I plan to add a tooltip with more information about the region, such as its address or its occupancy.
On the right you can see the list of all the GCs that happened since you attached to the process.
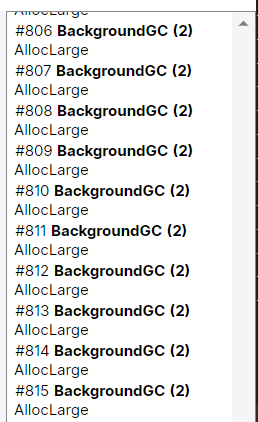
At every GC, a snapshot of the application is captured. A slider at the bottom allows you to navigate through the snapshots.

The snapshots are automatically replayed at a rate of 2 per second, unless you click the “Pause” button. You can also navigate through the snapshots using the arrow keys, or toggle play/pause with the space bar.
Of course, this only applies to live processes or saved traces, there is only one snapshot when opening a memory dump.
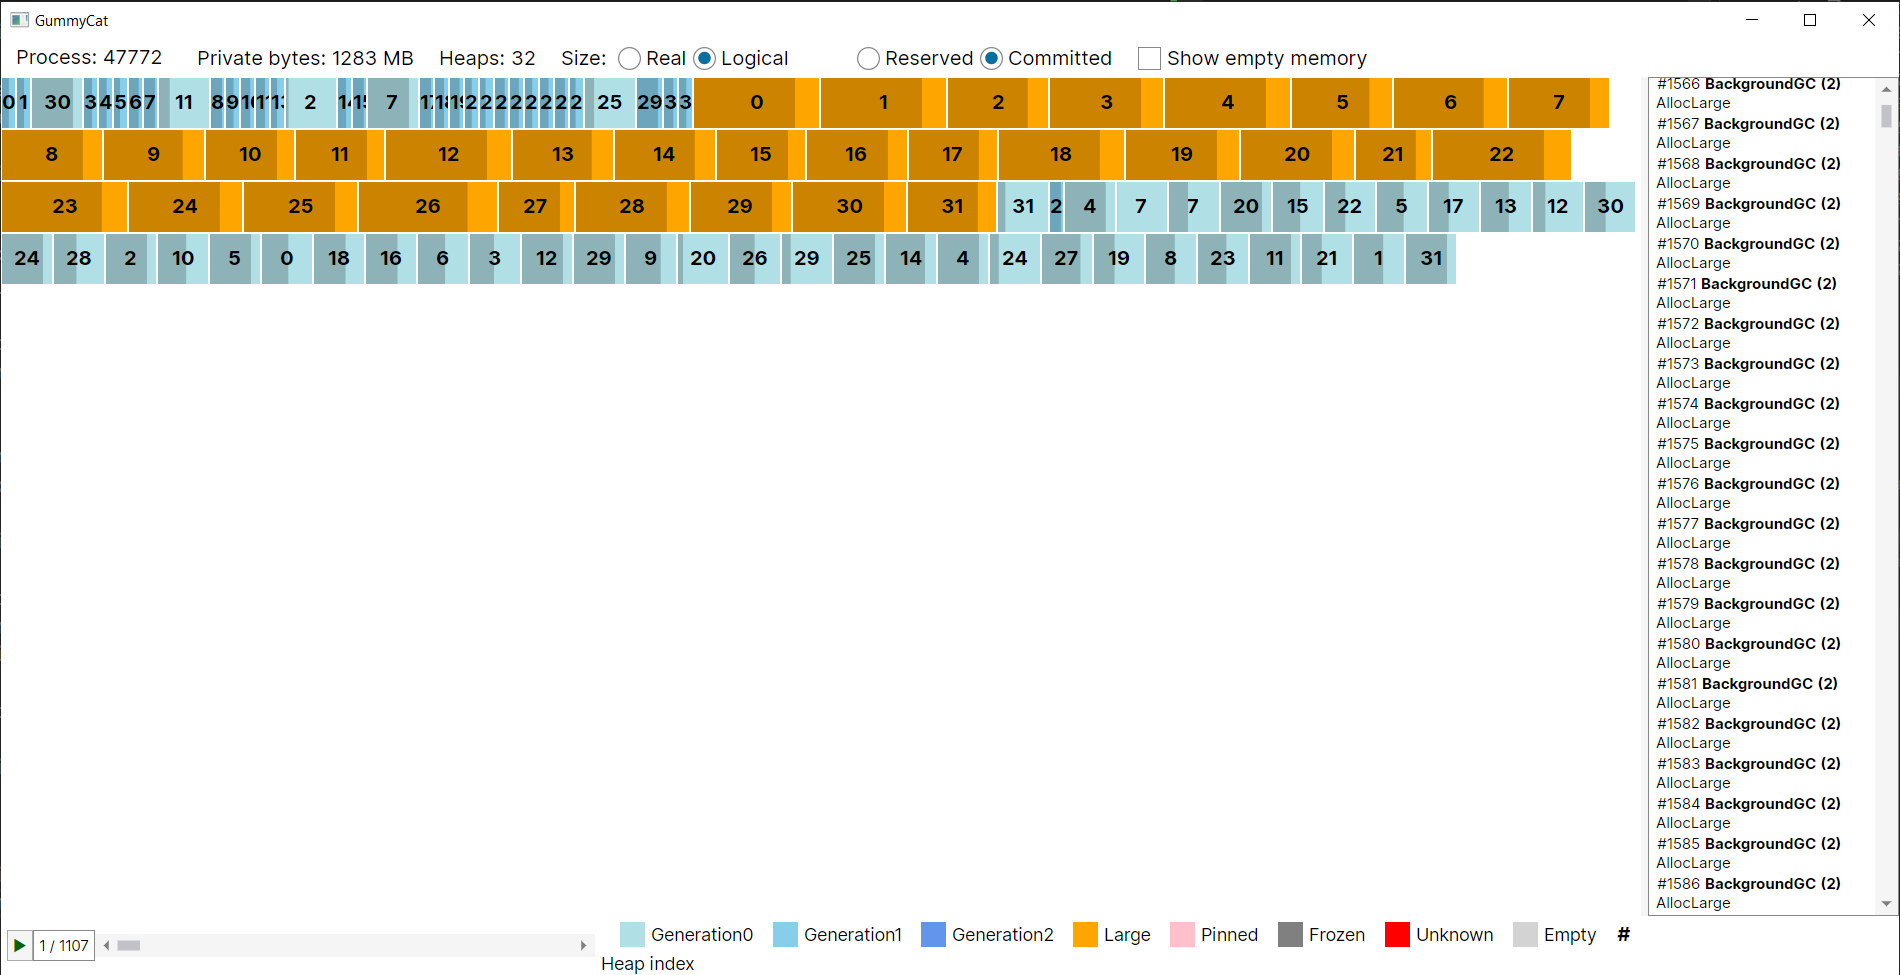
The “defrag view” is not always the best to understand what’s happening, so you can switch to the “logical view”. This view doesn’t show you the whole layout of the memory and instead focuses on listing the regions. It’s more compact and easier to read.
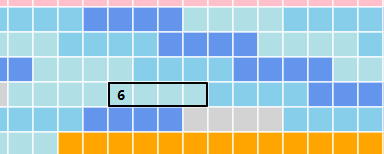
In this view you can also visually see the percentage of occupancy of each region. The number is the index of the heap, this is the same value that you would get by hovering in the “defrag” view.
Empty space is hidden by default, but you can show it by checking the “Show empty memory” box.
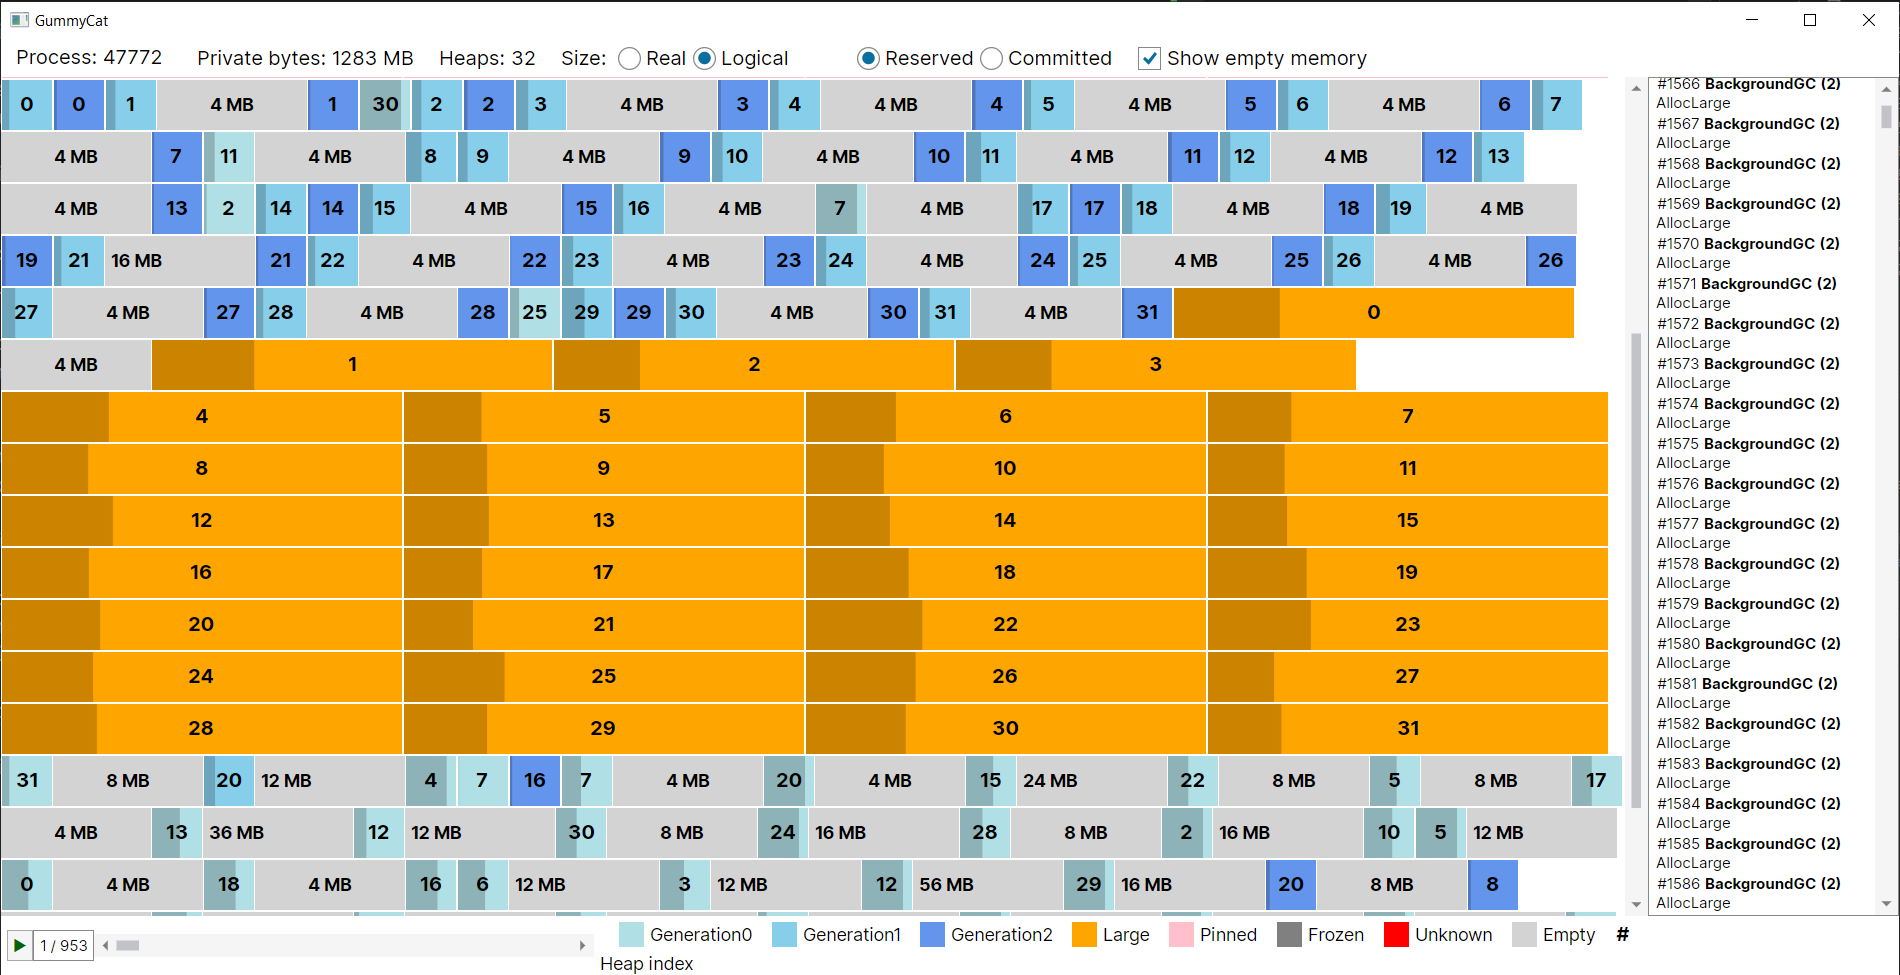
You can also choose to display the committed memory instead of the reserved memory, though there are some visual glitches with this option when the committed part of a region is too small.
The technical bits
GummyCat is based on two diagnostic mechanisms: event-pipes and ClrMD. Event-pipes are used to capture the GC events, to know when a new garbage collection is happening. After each GC, ClrMD is used to attach to the process and capture a snapshot of the heap.
One major caveat is that GC events are received asynchronously, and the memory layout might have changed quite a bit by the time ClrMD is attached to the process. Another garbage collection might even have happened in the meantime, so you don’t have a perfect mapping between the GC events and the snapshots. I’ll try to improve this in the future, either by trying to find all the information I need directly from the GC events, or by attaching a profiler that will freeze the application after each garbage collection until the snapshot is captured.
On the UI side, there isn’t much to say. As mentioned earlier, the application is build with Avalonia UI in order to be cross-platform. The code is really messy and reflects the “demo app that evolved into a real tool” nature of the project. Contributions are welcome and encouraged.