Investigating a deadlock in Visual Studio
This is the retelling of a fairly short debugging investigation. While it’s not as intricate as most of the investigations that I post on my blog, I thought this one is interesting because it showcases one of the most difficult and unexpected challenges you may face when writing a profiler.
It started as I opened Visual Studio 2026 to prototype some code, and the window seemingly froze.
Since I’m working on the performance of ReSharper, I immediately look into any unexpected delay when using Visual Studio. At this point, I thought that something was just taking a long time to initialize, and that it would only last a few seconds. As fast as I could, I launched the Superluminal Performance profiler and attached it to the instance of Visual Studio. I then waited for Visual Studio to finish loading, but after about 30 seconds I realized that it was taking way too long. I stopped the trace and checked the results.
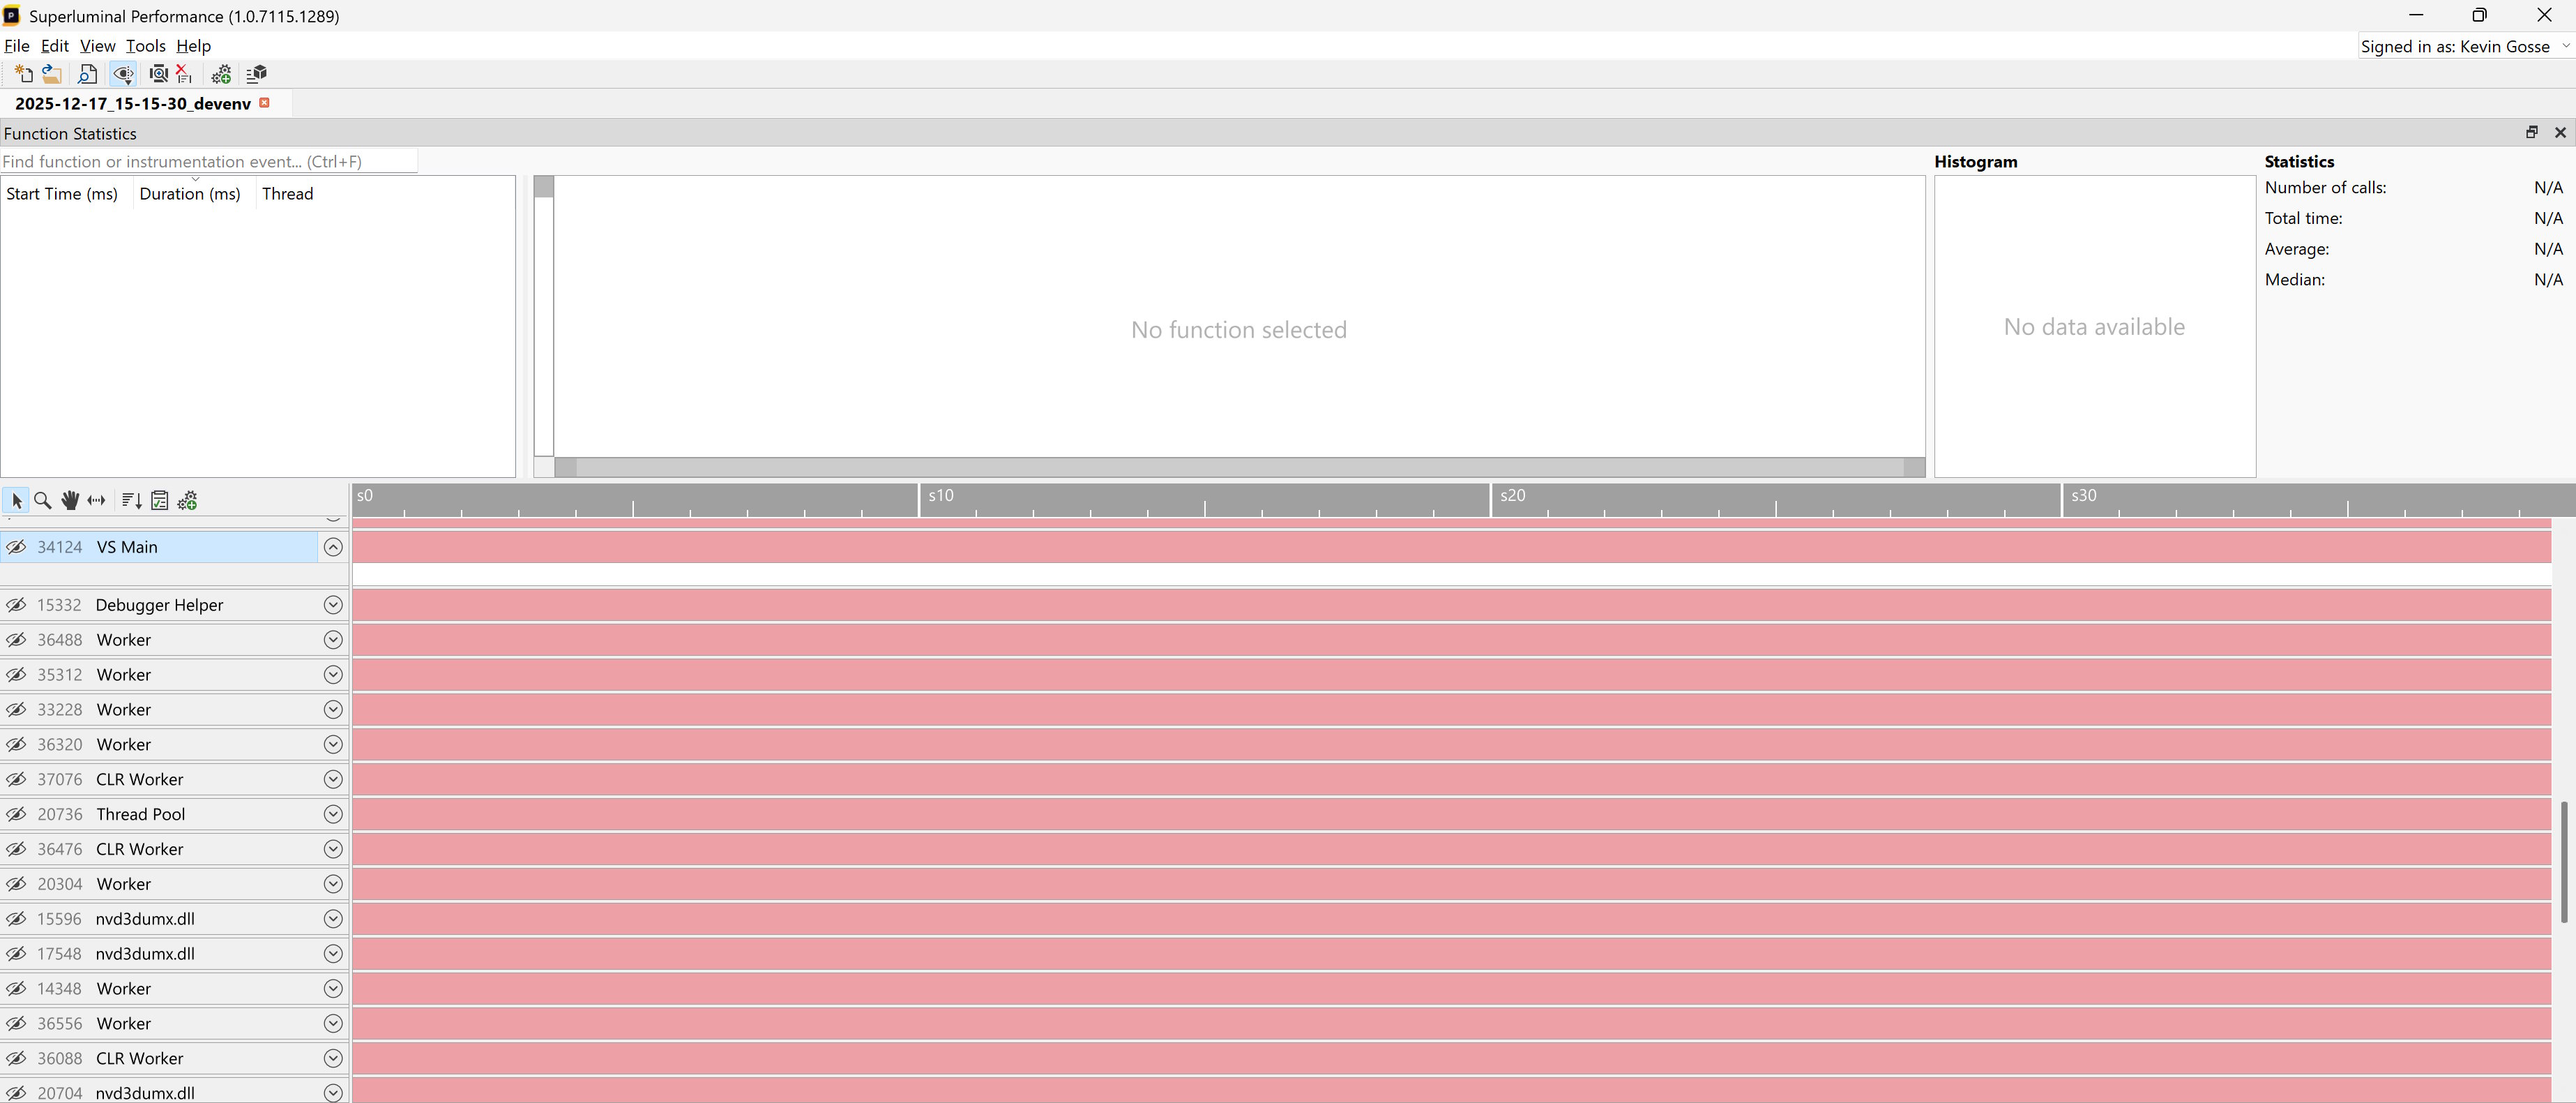
That was very intriguing as it showed that the process was doing pretty much… nothing. Meanwhile, Visual Studio was still frozen, so I finally understood that it was some sort of deadlock rather than a performance issue. I then captured a memory dump and loaded it into a fresh instance of Visual Studio.
In that situation you could be tempted to attach a debugger directly to the frozen process, but I strongly recommend not doing that unless you know that you can reproduce the issue. It’s not rare that a debugger causes the target process to completely crash, especially when it’s in an unstable state (which is the reason why you’re debugging it to begin with). I prefer to start my investigations from a memory dump while leaving the frozen process in the background, and only attach a debugger when I need some live data that can’t be extracted from the dump.
When investigating a deadlock, I always start by checking the “Parallel Stacks” view of Visual Studio:
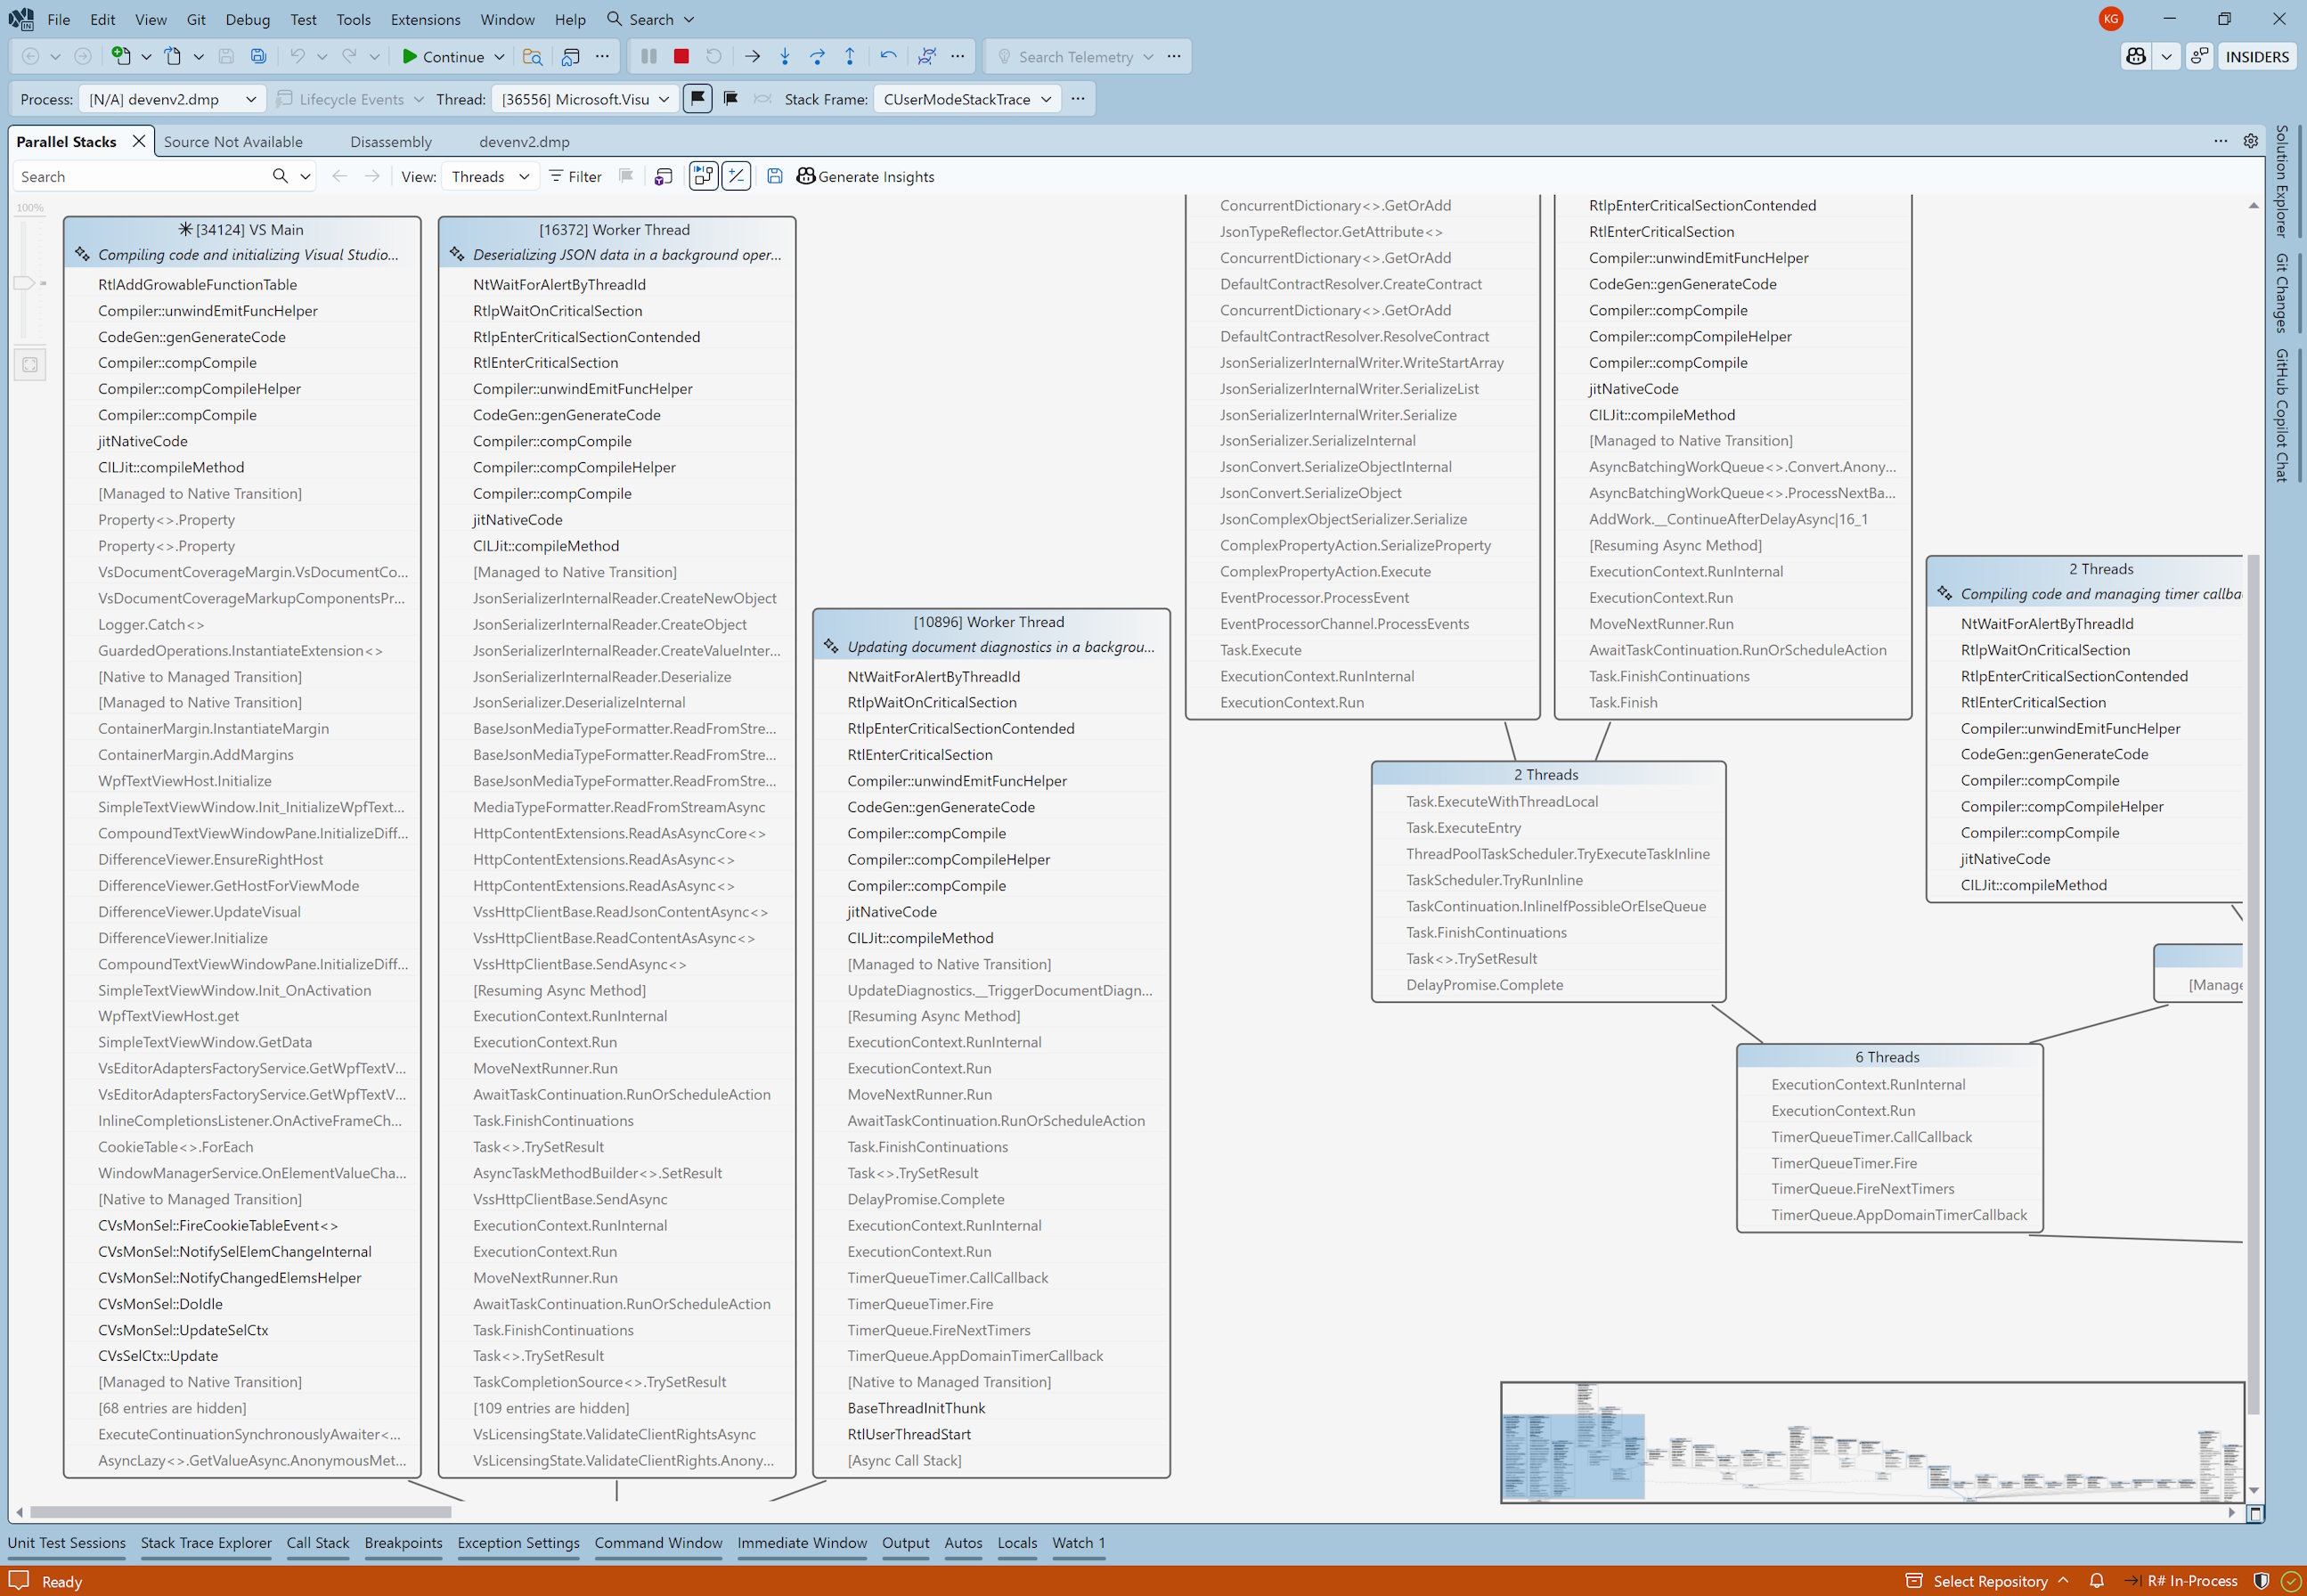
There were a ton of threads so at this point it was hard to know what was relevant or not. But I immediately noticed a few things:
- The main thread was JIT compiling some function (as indicated by the
CILJit::compileMethodframe), and was executingRtlAddGrowableFunctionTable. - Most of the other threads were stuck in
RtlEnterCriticalSectionwhile JIT compiling some code, probably waiting on a lock held by the main thread.
To be 100% sure that the main thread was indeed stuck, I captured a second memory dump and compared it to the first one. Sure enough, I found the same callstack.
To understand what exactly the main thread was blocked on, I checked the disassembly:
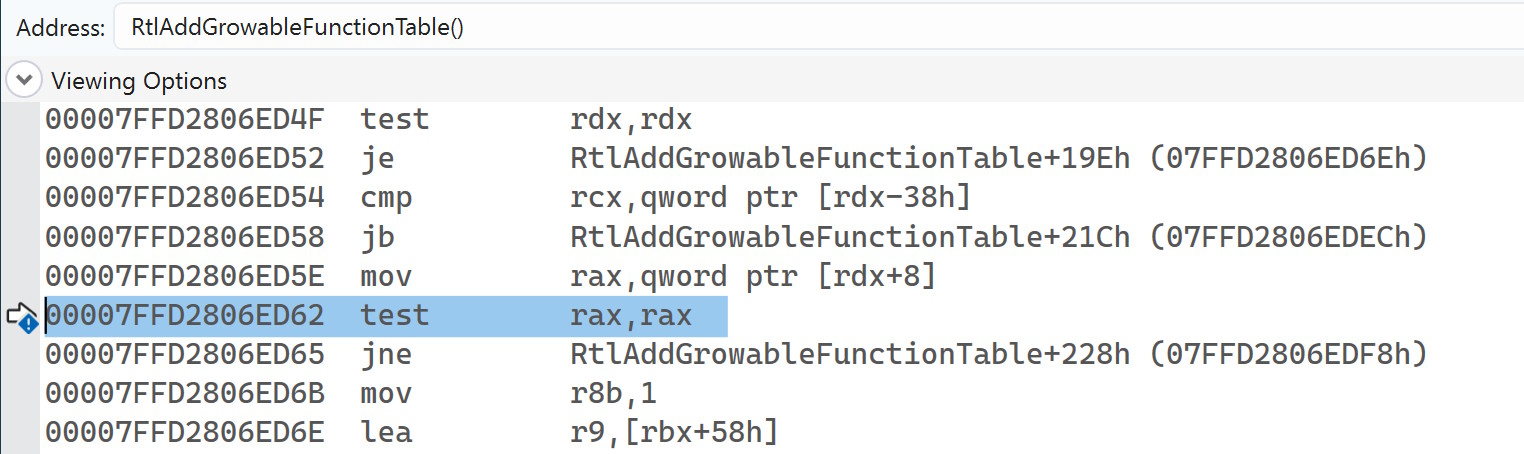
That was very unexpected. The thread was not waiting on a lock, or stuck in a syscall. It was just executing… test rax, rax. In other words, a simple null check. I double-checked in the other memory dump and yes: the thread was stuck on the exact same instruction.
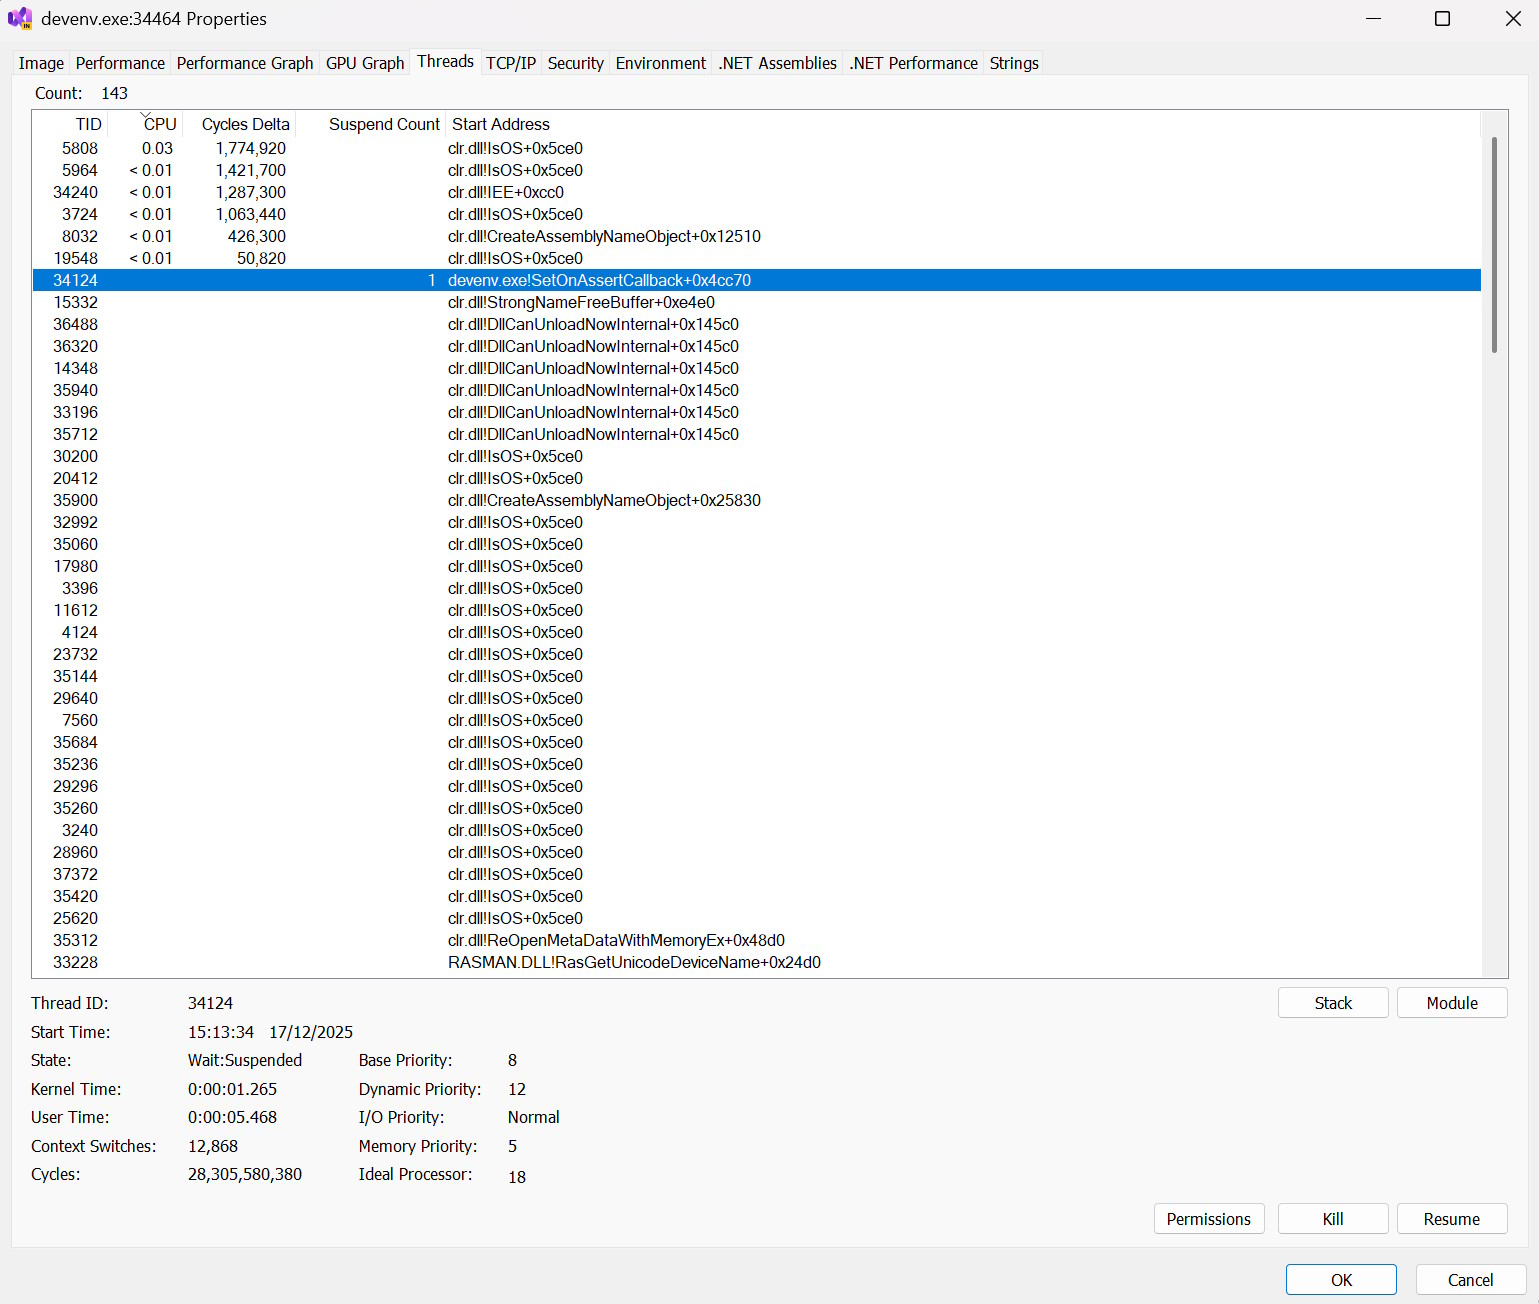
I know only one situation where this could happen: if the thread was suspended. This struck a bell because it looked a lot like a problem we had to deal with back at Datadog when writing profilers (foreshadowing). I tried to think of a way to verify this, and it’s surprisingly difficult. If you attach a debugger, you can’t run any command until you pause the execution. And when you do, of course the thread is going to be suspended, since you paused the execution! Eventually, after a completely unproductive discussion with ChatGPT, I checked Process Explorer and thankfully the “threads” tab gives the suspend count:
So Visual Studio was frozen because the main thread was suspended… Which begs the question: who suspended it? I already knew what to look for: in ReSharper we experimented with some watchdog to collect information when the UI thread is stuck for a long time, and I fully expected Visual Studio to have a similar mechanism. Sure enough, I found this thread:
NtWaitForAlertByThreadId()
RtlpAcquireSRWLockSharedContended()
RtlAcquireSRWLockShared()
RtlpLookupDynamicFunctionEntry()
RtlLookupFunctionEntry()
CUserModeStackTrace::GetStackTraceX64(struct _CONTEXT,unsigned short,unsigned __int64 *,unsigned short,unsigned short *)
CUserModeStackTrace::GetStackTraceOfThreadHandleImpl(void *,unsigned short,bool,unsigned __int64 *,unsigned short,unsigned short *)
CUserModeStackTrace::GetStackTraceOfThreadHandle(void *,unsigned __int64 *,unsigned short,unsigned short *,unsigned __int64 *)
`anonymous namespace'::PerfMonitoringHelper::GetBestCallStackForTargetThreadByHandle()
CResponsivenessMonitor::MonitorWorker(void)
CResponsivenessMonitor::ResponsivenessThreadProc(void *)
This “responsiveness monitor” was trying to inspect a thread (GetStackTraceX64) and got stuck while acquiring a lock in RtlLookupFunctionEntry. That lock was probably held by the main thread, which got suspended. To confirm that, I wanted to check what thread that “responsiveness monitor” was targeting. Thankfully, the name of some of the functions was quite explicit (GetStackTraceOfThreadHandle) so I loaded the stackframe for that function and inspected the registers to see if I could find a thread handle:
0:047> k
 # Child-SP          RetAddr               Call Site
00 00000017`4b27eae8 00007ffd`28030f4d     ntdll!NtWaitForAlertByThreadId+0x14
01 00000017`4b27eaf0 00007ffd`2803afa3     ntdll!RtlpAcquireSRWLockSharedContended+0x27d
02 00000017`4b27eb70 00007ffd`28100f0d     ntdll!RtlAcquireSRWLockShared+0x53
03 00000017`4b27eba0 00007ffd`2802e2fe     ntdll!RtlpLookupDynamicFunctionEntry+0x1d
04 00000017`4b27ebd0 00007ffc`26161eee     ntdll!RtlLookupFunctionEntry+0x35e
05 00000017`4b27ec20 00007ffc`26161e28     VsLog!CUserModeStackTrace::GetStackTraceX64+0x86
06 00000017`4b27edb0 00007ffc`26163baa     VsLog!CUserModeStackTrace::GetStackTraceOfThreadHandleImpl+0x150
07 00000017`4b27f7c0 00007ffc`26163a92     VsLog!CUserModeStackTrace::GetStackTraceOfThreadHandle+0x5a
08 00000017`4b27f800 00007ffc`261391ec     VsLog!`anonymous namespace'::PerfMonitoringHelper::GetBestCallStackForTargetThreadByHandle+0x102
09 00000017`4b27f8a0 00007ffc`2613897b     Microsoft_VisualStudio_PerfWatson_Provider!CResponsivenessMonitor::MonitorWorker+0x65c
0a 00000017`4b27fa80 00007ffd`2652e8d7     Microsoft_VisualStudio_PerfWatson_Provider!CResponsivenessMonitor::ResponsivenessThreadProc+0x1b
0b 00000017`4b27fab0 00007ffd`280ac53c     kernel32!BaseThreadInitThunk+0x17
0c 00000017`4b27fae0 00000000`00000000     ntdll!RtlUserThreadStart+0x2c

0:047> .frame /r 6
06 00000017`4b27edb0 00007ffc`26163baa     VsLog!CUserModeStackTrace::GetStackTraceOfThreadHandleImpl+0x150
rax=00000000000001e3 rbx=00000000000014a4 rcx=00007ffd281f4250
rdx=0000000000000000 rsi=000000174b27f900 rdi=0000000000000000
rip=00007ffc26161e28 rsp=000000174b27edb0 rbp=000001580648ce50
 r8=0000480febfdc84d  r9=0000480febfdc845 r10=00007ffd281f4250
r11=00007ffd281f4250 r12=00000000000014a4 r13=000000000000005b
r14=000000174b27f928 r15=0000000000000000
iopl=0         nv up ei pl zr na po nc
cs=0033  ss=002b  ds=002b  es=002b  fs=0053  gs=002b             efl=00000246
VsLog!CUserModeStackTrace::GetStackTraceOfThreadHandleImpl+0x150:
k displays the callstack, then .frame /r displays the registers for the given stackframe. In this case, I loaded the registers for the stackframe 6, which was GetStackTraceOfThreadHandleImpl. Then I looked for anything that looked like a handle. On Windows, a handle is actually just an index to some internal table, so the value is expected to be very small. Two registers had promising values: rax=1e3 and rbx=14a4. I inspected each of them with the !handle command:
0:047> !handle 1e3
Handle 00000000000001e3
  Type         	Mutant
0:047> !handle 14a4
Handle 00000000000014a4
  Type         	Thread
One of the values was indeed a thread handle! I then used the f flag to display all the information about the handle:
0:047> !handle 14a4 f
Handle 00000000000014a4
  Type         	Thread
  Attributes   	0
  GrantedAccess	0x1fffff:
         Delete,ReadControl,WriteDac,WriteOwner,Synch
         Terminate,Suspend,Alert,GetContext,SetContext,SetInfo,QueryInfo,SetToken,Impersonate,DirectImpersonate
  HandleCount  	7
  PointerCount 	196433
  Name         	<none>
  Object specific information
    Thread Id   86a0.854c
    Priority    10
    Base Priority 0
The Thread Id 86a0.854c part matched the id of the main thread, which confirmed my theory.
Writing profilers is hard
So, what happened? For some reason, the “responsiveness monitor” built into Visual Studio decided to inspect the main thread. To walk the callstack of a thread on Windows x64, what you need to do is:
- Suspend the thread
- Call
GetThreadContextto get the current value of the registers for the target thread - For each frame, call
RtlLookupFunctionEntrythenRtlVirtualUnwindto move to the next frame - After walking the full callstack, resume the thread
The issue happened during step 3: to read the function table, RtlLookupFunctionEntry needs to acquire a lock, and that lock was held by the suspended thread! This is a common situation that profilers must deal with. And this is not limited to RtlLookupFunctionEntry, anything that the profiler does that requires locking could cause a deadlock if it’s done while another thread is suspended (some common examples include allocating memory, which requires the heap lock, or loading a DLL, which requires the loader lock). And this is not limited to Windows, Linux profilers face the exact same issue.
What can be done about it? Unfortunately there is no great solution. Speaking from experience, the Datadog continuous profiler uses two different approaches:
- On Windows, it uses an additional “deadlock monitor” thread. Its responsibility is to make sure that the profiler thread is making some progress. If the profiler thread takes too long, it assumes that a deadlock occured and forcefully resumes the suspended thread, thus resolving the deadlock. It generally works but it has a few drawbacks: because the approach is based on a timeout, it takes some time to detect the deadlock, which negatively impacts the performance of the profiled application. Also, the deadlock monitor cannot use any Windows API that requires a lock, lest it itself becomes deadlocked.
- On Linux, it detours libc functions that may cause deadlocks (
dlopen,pthread_create, to name a few), so that the profiler knows not to suspend a thread that is currently executing them. The drawbacks here are that it’s hard to build an exhaustive list of calls to detour (you have to discover them the hard way), and it skews the profiling (since a thread is never profiled while calling these functions, it might appear as if it’s doing less work than it actually is).
It was really interesting for me to see the Visual Studio team, with all their experience, fall into the same pitfalls as we did back when I worked at Datadog (to be clear, I’m not shaming. This is a very, very tough problem to solve). Nowadays, when writing a profiler with Silhouette, I usually rely on ICorProfilerInfo10::SuspendRuntime, which delegates to the .NET runtime the responsibility of finding a good place to stop the threads. Under the hood it uses the same APIs as the garbage collector, so it’s battle-tested. The major drawback is that suspends all threads instead of just one, so this is not a great approach when performance is a concern.