Crash in the crash-analyzer
At Datadog, I’m currently working on a crash-analyzer product. The goal is to detect crashes in .NET applications and generate automated reports to help developers understand what went wrong. Without going too deep into the technical details, this is a complex piece of technology that involves using a library injected with LD_PRELOAD to hook the execve syscall, and redirecting calls to createdump to instead spawn a custom utility to collect crash data. That custom utility (that will be referred to as dd-dotnet) is a .NET application compiled with NativeAOT. Its job is to inspect the memory of the crashed process to extract the native and managed callstacks of all the threads. To walk the stacks, it uses a combination of libunwind (to walk the native stack) and ClrMD (to resolve the managed frames).
To summarize:
- A .NET application is launched, we inject a library into it to hook the
execvesyscall - The .NET application crashes, the CLR tries to launch
createdumpto generate a coredump - Thanks to the
execvehook, we intercept the syscall and launchdd-dotnetinstead dd-dotnetinspects the memory of the crashed process to extract the callstacks
Suffice to say that it kept me busy for a while. But when nearing completion, I noticed that dd-dotnet was randomly crashing with a segmentation fault. Ironic, isn’t it?
Early analysis
Because of the complexity of the setup, I quickly discarded the idea of using a debugger to investigate the issue. The syscall hooking interfered with the debugger, and the crash happened in a child process which made it hard to attach a debugger at the right time.
Many debuggers offer the ability to automatically attach to child processes, but given that the parent process has to crash (on purpose), it’s hard to instruct the debugger to ignore the errors in the parent process but then break in the child process. And since the crash is random, I would have to do the whole thing multiple times before hitting the issue. I’m tired just thinking about it.
So instead, I configured Linux (oh yeah, have I mentioned that it’s on Linux?) to automatically generate a coredump and I just launched the app as many times as needed to reproduce the issue. With my precious coredump in hand, I then loaded it in WinDbg (yes, on Windows) to analyze the crash.
 I'll say it. There is no better tool to open Linux coredumps than WinDbg on Windows. That's crazy.
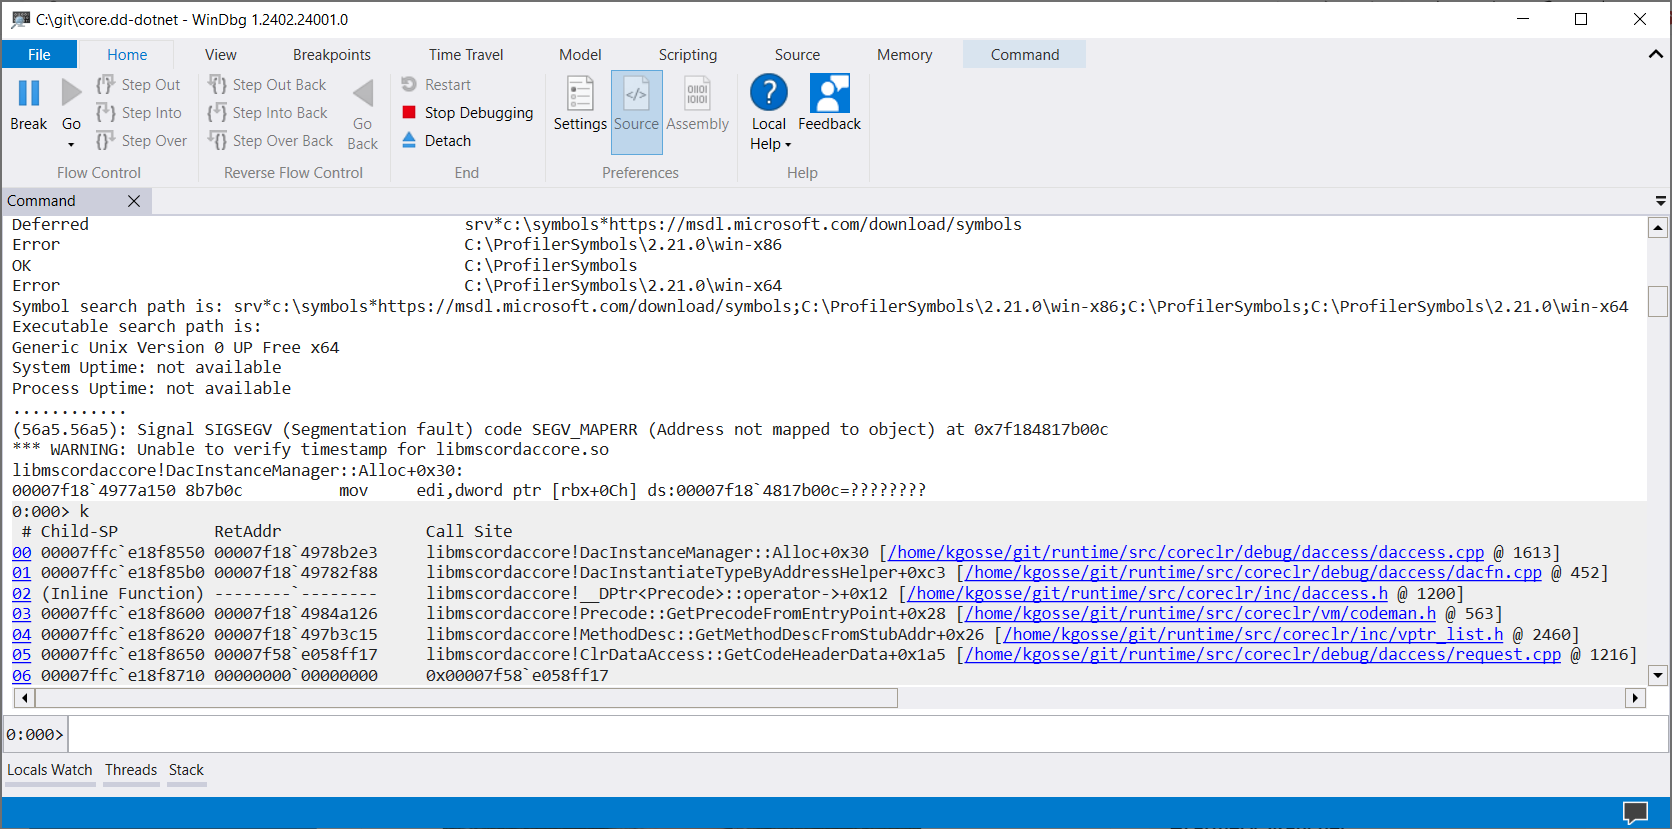
Immediately, WinDbg gave some interesting information about the crash:
(56a5.56a5): Signal SIGSEGV (Segmentation fault) code SEGV_MAPERR (Address not mapped to object) at 0x7f184817b00c
*** WARNING: Unable to verify timestamp for libmscordaccore.so
libmscordaccore!DacInstanceManager::Alloc+0x30:
00007f18`4977a150 8b7b0c          mov     edi,dword ptr [rbx+0Ch] ds:00007f18`4817b00c=????????
The crash was happening in libmscordaccore.so (also known as the “DAC”), which is a library that ships with .NET and that contains the logic to inspect the memory of a .NET process. It is used under the hood by ClrMD. The crash happened because the method DacInstanceManager::Alloc tried to read the memory address 0x7f184817b00c, which was apparently not mapped. What’s particularly interesting about that address is that it looks valid. It’s not something like 0x000000000000xxxx or 0xffffffffffffxxxx which would usually indicate an operation on a null pointer. Rather, it seems to point towards an use-after-free or a buffer overflow. The former seemed more likely because there was no valid memory around that address.
The full callstack didn’t give much more information:
0:000> k
 # Child-SP          RetAddr               Call Site
00 00007ffc`e18f8550 00007f18`4978b2e3     libmscordaccore!DacInstanceManager::Alloc+0x30 [/home/kgosse/git/runtime/src/coreclr/debug/daccess/daccess.cpp @ 1613]
01 00007ffc`e18f85b0 00007f18`49782f88     libmscordaccore!DacInstantiateTypeByAddressHelper+0xc3 [/home/kgosse/git/runtime/src/coreclr/debug/daccess/dacfn.cpp @ 452]
02 (Inline Function) --------`--------     libmscordaccore!__DPtr<Precode>::operator->+0x12 [/home/kgosse/git/runtime/src/coreclr/inc/daccess.h @ 1200]
03 00007ffc`e18f8600 00007f18`4984a126     libmscordaccore!Precode::GetPrecodeFromEntryPoint+0x28 [/home/kgosse/git/runtime/src/coreclr/vm/codeman.h @ 563]
04 00007ffc`e18f8620 00007f18`497b3c15     libmscordaccore!MethodDesc::GetMethodDescFromStubAddr+0x26 [/home/kgosse/git/runtime/src/coreclr/inc/vptr_list.h @ 2460]
05 00007ffc`e18f8650 00007f58`e058ff17     libmscordaccore!ClrDataAccess::GetCodeHeaderData+0x1a5 [/home/kgosse/git/runtime/src/coreclr/debug/daccess/request.cpp @ 1216]
06 00007ffc`e18f8710 00000000`00000000     0x00007f58`e058ff17
Just in case, I also checked the managed callstack by manually loading the cross-platform SOS extension.
WinDbg is bundled with an old version of SOS that is automatically loaded. If you want to debug cross-platform memory dumps, you need to install dotnet-sos and load it manually with
.load C:\Users\yourProfile\.dotnet\sos\sos.dll.
0:000> .load C:\Users\kevin.gosse\.dotnet\sos\sos.dll
0:000> !clrstack
OS Thread Id: 0x66e9 (0)
        Child SP               IP Call Site
00007FFC9B4E4898 00007f0004fe33b8 [InlinedCallFrame: 00007ffc9b4e4898]
00007FFC9B4E4898 00007eff8d689e4c [InlinedCallFrame: 00007ffc9b4e4898]
00007FFC9B4E4890 00007eff8d689e4c ILStubClass.IL_STUB_PInvoke(IntPtr, Microsoft.Diagnostics.Runtime.DacInterface.ClrDataAddress, Microsoft.Diagnostics.Runtime.DacInterface.CodeHeaderData ByRef)
00007FFC9B4E4920 00007eff8d689da9 Microsoft.Diagnostics.Runtime.DacInterface.SOSDac.GetCodeHeaderData(UInt64, Microsoft.Diagnostics.Runtime.DacInterface.CodeHeaderData ByRef) [D:\a\_work\1\s\src\Microsoft.Diagnostics.Runtime\DacInterface\SosDac.cs @ 252]
00007FFC9B4E4960 00007eff8d689a40 Microsoft.Diagnostics.Runtime.DacImplementation.DacMethodLocator.GetMethodHandleByInstructionPointer(UInt64) [D:\a\_work\1\s\src\Microsoft.Diagnostics.Runtime\DacImplementation\DacMethodLocator.cs @ 31]
00007FFC9B4E49D0 00007eff8d68903e Microsoft.Diagnostics.Runtime.ClrRuntime.GetMethodByInstructionPointer(UInt64) [D:\a\_work\1\s\src\Microsoft.Diagnostics.Runtime\ClrRuntime.cs @ 254]
[...]
It confirmed that ClrMD was calling the DAC to resolve a function, and this is where the crash happened. The DAC is a battle-tested library and its code doesn’t evolve much, so it seemed very unlikely that a bug of that severity would be present in it. With that in mind, I started by suspecting ClrMD, and I checked the source code to see if I could find anything suspicious. It was fairly straightforward, with no obvious mistake, so I quickly circled back to the DAC.
Investigating the DAC
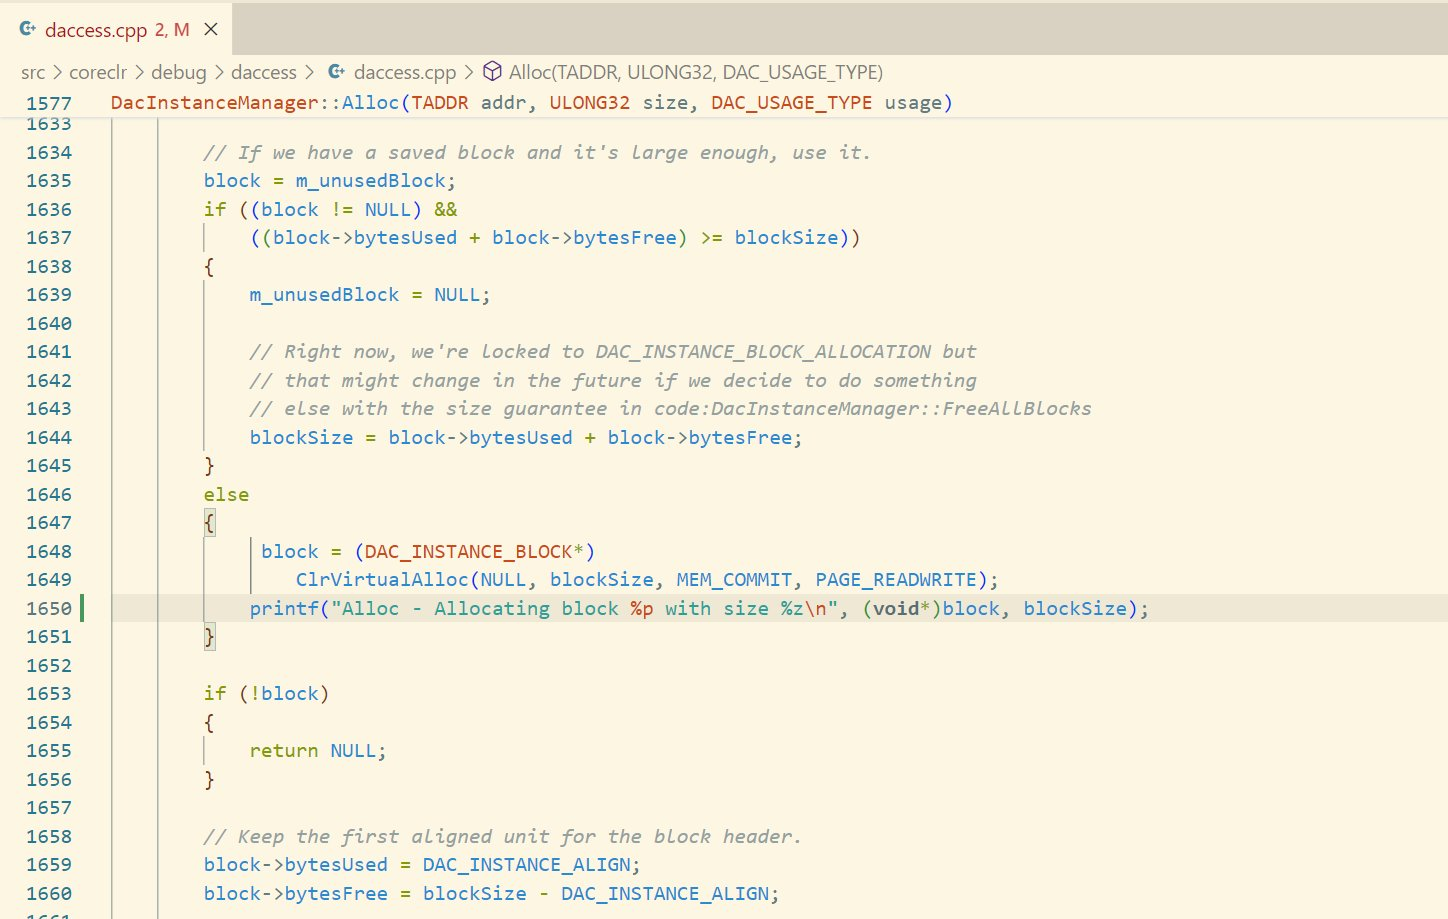
The DAC is optimized for scenarios where memory accesses to the target process are costly (remote process, memory dump, …). Pretty much all the data it reads is cached, and only freed when the Flush method is called. The DacInstanceManager::Alloc method that caused the crash is a custom allocator, responsible for allocating memory by chunks and returning pointers to the caller. That memory is never freed unless the Flush method is called, which shouldn’t happen in my scenario. To validate my assumptions, I built a custom version of .NET where I added printf statements around allocations and deallocations in the DAC. And indeed, the memory was never freed.
 Never underestimate the power of printf statements for debugging
I even went one step further and added printf statements to the ClrVirtualAlloc and ClrVirtualFree functions, used by the CLR to allocate and free memory. This confirmed without a doubt that the DAC wasn’t freeing that memory, and therefore couldn’t be causing the issue.
$ ./bin/Debug/net8.0/console
Hello, World!
Unhandled exception. System.InvalidOperationException: argh
   at Program.Main() in /home/kgosse/console/Program.cs:line 33
Capturing crash info for process 17561
VirtualAlloc(lpAddress=(nil), dwSize=262144, flAllocationType=0x1000, flProtect=0x4)
Alloc - Allocating block 0x7f560c026000 with size 262144
VirtualAlloc(lpAddress=(nil), dwSize=4194304, flAllocationType=0x1000, flProtect=0x4)
Add - Allocating block (nil) with size 4194304
VirtualAlloc(lpAddress=(nil), dwSize=2680352, flAllocationType=0x1000, flProtect=0x4)
Alloc - Allocating block 0x7f5604aa0000 with size 2680352
VirtualAlloc(lpAddress=(nil), dwSize=262144, flAllocationType=0x1000, flProtect=0x4)
Alloc - Allocating block 0x7f5604622000 with size 262144
Aborted
It also helped me confirm that the invalid memory address had been previously allocated by the DAC, ruling out the theory of the buffer overflow. Something was freeing memory that was owned by the DAC, and I had to find what. The main difficulty with this kind of bug is that the crash occurs long after the actual issue, making it hard to find the root cause.
There were five components in my program that could cause the issue:
- The DAC
- ClrMD
- libunwind
- Some C++ code that I wrote on top of libunwind, to walk the native stack
- The C# code in
dd-dotnetthat orchestrates everything
At this point, the DAC and ClrMD were almost certainly not the culprits. The C# code in dd-dotnet did some advanced native interop stuff, but I carefully reviewed the code and couldn’t find anything suspicious. That left libunwind and my C++ code. And I’m very, very bad at C++.
There are a number of tools to catch memory issues in native code, like Valgrind or AddressSanitizer. Unfortunately, none of them worked with my setup. It was time to get my hands dirty and build my own tool.
Ultimately, I needed two things:
- First, confirm that the memory was being freed. At this point I knew that the DAC was allocating that memory and that it somehow became invalid. But while fairly obvious, I had no definite proof that this memory was being freed, and years of advanced debugging taught me to validate even the most obvious assumptions.
- And secondly, find out who was freeing it.
A good way to do that was to trace the mmap/munmap system calls, respectively used to map and unmap a region of memory on Linux. The strace tool would normally be the way to go, and it even has a -f option to trace child processes. This was great for my use-case because, as a reminder, I needed to launch an app that would spawn dd-dotnet when crashing.
However, things didn’t go as planned. dd-dotnet relies on the ptrace syscall to freeze the threads of the parent process for inspection, but those calls failed when strace was attached, causing the execution to stop before reaching the point of the crash. I needed a less intrusive way of tracing system calls, and fortunately there is one: eBPF.
eBPF to the rescue
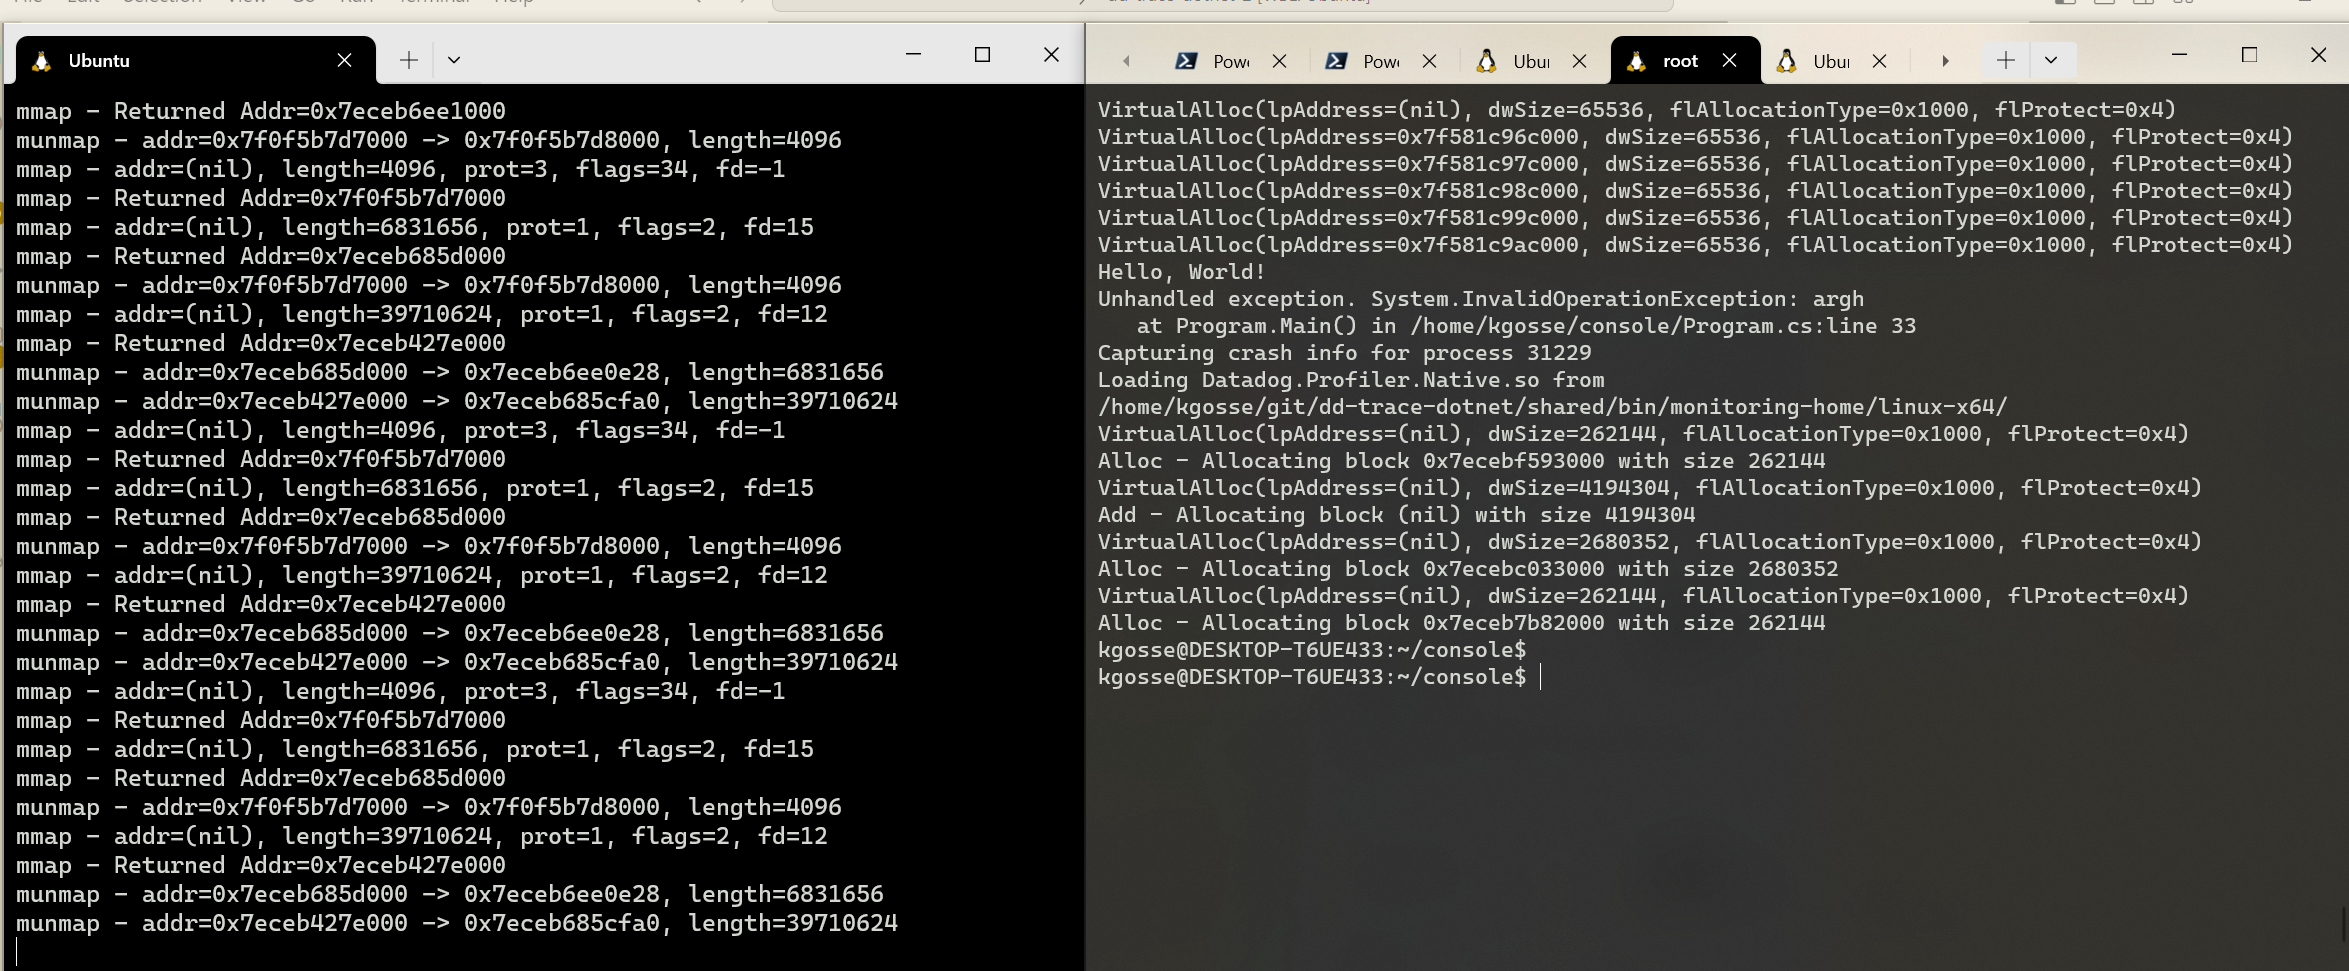
eBPF is a really neat technology that allows you to run small programs in the kernel. A good way to use it is through bpftrace, which provides a higher-level abstraction on top of eBPF. Among other things, it can be used to be notified of system calls and inspect their arguments. With the help of ChatGPT, I wrote a small script that would trace the mmap and munmap system calls, and log the addresses and sizes of the memory regions that were mapped and unmapped.
tracepoint:syscalls:sys_enter_mmap
/comm == "dd-dotnet"/
{
   printf("mmap - addr=%p, length=%d, prot=%d, flags=%d, fd=%d\n",
          args->addr, args->len, args->prot, args->flags, args->fd);
}

tracepoint:syscalls:sys_exit_mmap
/comm == "dd-dotnet"/
{
       printf("mmap - Returned Addr=%p\n", args->ret);
}

tracepoint:syscalls:sys_enter_munmap
/comm == "dd-dotnet"/
{
   printf("munmap - addr=%p -> %p, length=%d\n", args->addr, args->addr + args->len, args->len);
}
Let’s break it down quickly:
tracepoint:syscalls:sys_enter_mmap: This function will be called at the beginning of themmapsyscall (same thing fortracepoint:syscalls:sys_enter_munmapformunmap)./comm == "dd-dotnet"/: This is a filter to only trace the syscalls of the process nameddd-dotnet.- Then inside of the function, we use
printfto log the arguments of the syscall. mmapcan be called with a null address, in which case it will automatically assign an address as the return parameter. To log it, we need to trace the end of the syscall, hence thetracepoint:syscalls:sys_exit_mmapfunction.
The script can be simply run with the bpftrace <file> command:
$ sudo bpftrace trace_mmap.bt
The output was quite verbose, so I wrote a small C# program to parse it and find if the range of any munmap call covered the address that was allocated by the DAC.
static void Main(string[] args)
{
    ulong target = 0x7f184817b000;
    int count = 0;

    foreach (var line in File.ReadLines("output.txt"))
    {
        count++;
        // munmap - addr=0x7f184812d000 -> 0x7f18481ba400
        var unmapMatch = Regex.Match(line, @"munmap - addr=0x(?<start>[0-9a-f]+) -> 0x(?<end>[0-9a-f]+)");

        if (unmapMatch.Success)
        {
            var start = ulong.Parse(unmapMatch.Groups["start"].Value, System.Globalization.NumberStyles.HexNumber);
            var end = ulong.Parse(unmapMatch.Groups["end"].Value, System.Globalization.NumberStyles.HexNumber);

            if (target >= start && target <= end)
            {
                Console.WriteLine($"Line {count}: {line}");
            }
        }
    }
}
This gave me the line of the munmap call in the eBPF output that was causing the issue. This information, combined with the printf statements that I added earlier in the DAC, confirmed my suspicions.
Program output:
Alloc - Allocating block 0x7f184817b000 with size 262144
eBPF output (annotated):
[...]
mmap - addr=(nil), length=578560, prot=1, flags=2, fd=15 // Somebody is asking for some memory
mmap - Returned Addr=0x7f184812d000 // They receive the 0x7f184812d000 -> 0x7f18481ba400 range
munmap - addr=0x7f184812d000 -> 0x7f18481ba400, length=578560 // They free it
munmap - addr=0x7f58e169a000 -> 0x7f58e169b000, length=4096 // Unrelated
mmap - addr=(nil), length=262144, prot=0, flags=34, fd=-1 // The DAC call
mmap - Returned Addr=0x7f184817b000 // The 0x7f184817b000 address is now reserved by the DAC
munmap - addr=0x7f184812d000 -> 0x7f18481ba400, length=578560 // The range is freed again
[...]
First we see a call to mmap with a null address and a length of 578560. The returned address is 0x7f184812d000, thus mapping the range 0x7f184812d000 -> 0x7f18481ba400. Then a call to munmap unmaps that range. We have another mmap call with a length of 4096 that is unrelated, then a call to mmap with a length of 262144 that returns the address 0x7f184817b000. This is the call that is made from the DAC. Finally, the range 0x7f184812d000 -> 0x7f18481ba400 is unmapped a second time.
The address 0x7f184817b000 mapped by the DAC is within the 0x7f184812d000 -> 0x7f18481ba400 range, and so it becomes invalid when that range is unmapped.
This is undoubtedly a case of double-free. Whoever mapped the 0x7f184812d000 -> 0x7f18481ba400 range unmapped it twice. Now I had to figure out who did that.
bpftrace supports displaying stacktraces by calling ustack() in the script. Unfortunately, the stacktraces were broken and therefore didn’t provide any useful information. Apparently it can happen if the caller is compiled with frame pointers disabled. I had to find another way.
The next level of printf debugging
At this point, it’s important to understand that bpftrace is a separate tool, running in a separate console. Therefore, I had on one side the output of the program, and on the other the output of bpftrace. They’re completely separate, with no way to chronologically correlate the events. It was therefore not possible to just put printf calls everywhere in the code to pinpoint the moment when the second munmap call was made. Instead of a classic printf, I needed a way to send information directly to the bpftrace output.
 bpftrace and the console output are in separate consoles, there is no easy way to tell which event came before which.
Since bpftrace traces syscalls, maybe there was one that I could abuse? After some back and forth with ChatGPT, I decided on the prctl(PR_GET_DUMPABLE, unsigned long arg2) syscall. I don’t really understand what it does, and I don’t really care. What’s important is that it has an argument in which I can pass an arbitrary value, and it doesn’t affect the behavior of my program. I updated the bpftrace script to trace this syscall and log the value of the argument:
tracepoint:syscalls:sys_enter_prctl
/comm == "dd-dotnet"/
{
        printf("prctl %d - Arg2=%d\n", args->option, args->arg2);
}
I started littering my code with calls to prctl, using different values of the argument to identify different lines of code. Then, in the bpftrace output, it was just a matter of looking at the values passed to prctl around the second munmap call.
[...]
prctl 4 - Arg2=8888
mmap - addr=(nil), length=578560, prot=1, flags=2, fd=15
mmap - Returned Addr=0x7f184812d000
munmap - addr=0x7f184812d000 -> 0x7f18481ba400, length=578560
munmap - addr=0x7f58e169a000 -> 0x7f58e169b000, length=4096
prctl 4 - Arg2=9999
prctl 4 - Arg2=1000
prctl 4 - Arg2=1111
mmap - addr=(nil), length=262144, prot=0, flags=34, fd=-1
mmap - Returned Addr=0x7f184817b000
prctl 4 - Arg2=2222
prctl 4 - Arg2=8888
munmap - addr=0x7f184812d000 -> 0x7f18481ba400, length=578560
[...]
mmap - addr=(nil), length=262144, prot=0, flags=34, fd=-1 is the call made by the DAC, getting the address 0x7f184817b000. Before and after, we see the two munmap calls, between the prctl calls with the values 8888 and 9999 (the values are looping because this part of the code is, well, a loop). With that information, I was able to conclude that the issue was happening in the unw_step function of libunwind, used to walk the native stack. The relevant part of my code looked something like:
// Walk the native stack
do
{
    prctl(PR_SET_DUMPABLE, 1000, 0, 0, 0);
    unw_get_reg(&cursor, UNW_REG_IP, &ip);
    [...]

    prctl(PR_SET_DUMPABLE, 1111, 0, 0, 0);
    [...] // Call the DAC

    prctl(PR_SET_DUMPABLE, 2222, 0, 0, 0);
    [...]

    prctl(PR_SET_DUMPABLE, 8888, 0, 0, 0);
    step = unw_step(&cursor);
    prctl(PR_SET_DUMPABLE, 9999, 0, 0, 0);
} while (step > 0);
During one iteration of the loop, unw_step mapped then unmapped the memory range. In the next iteration, the DAC mapped an address in that range, then the next call to unw_step unmapped the range again.
But there was still a lot to do. libunwind is a complex library, and there are many places where it allocates or frees memory. But all the allocations in this library go through the mi_map and mi_unmap functions, respectively calling mmap and munmap, so I built a custom version of the library and dumped the callstack of every call to these functions. This allowed me to identify the exact call that was causing the issue.
 static ALWAYS_INLINE int
mi_munmap (void *addr, size_t len)
{
  // Capture and print the backtrace
  printf("mi_munmap %p\n", addr);
  void* array[10];
  size_t size = backtrace(array, 10);
  printf("backtrace:\n");
  char** strings = backtrace_symbols(array, size);
  size_t i;
  for (i = 0; i < size; i++)
  {
    printf("%zu: %s\n", i, strings[i]);
  }
  free(strings);

  // Original code
#ifdef SYS_munmap
  return syscall (SYS_munmap, addr, len);
#else
  return munmap (addr, len);
#endif
}
From there, identifying and understanding the issue was fairly straightforward, and the fix was a one-liner.
Conclusion
This was a very interesting debugging journey. Because of the atypical and complex setup, none of my usual tools were usable and I had to go back to the dark arts of printf-debugging. There is an age-old debate going on about whether you should prefer a debugger or printf statements. Ultimately, I believe that being familiar with debuggers will save you a ton of time in the long run, but there will always be cases where simple printf statements are the best tool for the job.