Using profiler function hooks in .NET with Silhouette
I’ve already talked about Silhouette in the past, the library that I’m building to make it possible to write .NET profilers in C#. It covers most of the features offered by the profiler API, and I’ve even been using it for professional projects. However, there was still one blind-spot that I wasn’t sure how to address.
The .NET profiling API allows to register function hooks, that will be called whenever a function is entered or exited. This is rarely used because of the performance impact it has, but it can be useful for very specific scenarios, for instance for writing a tracing profiler.
Sampling vs tracing profilers
Sampling profilers are the most common type of profilers. They work by periodically interrupting the profiled application to take a snapshot of its callstacks. This usually has a low overhead and gives a good overview of where time is spent in the application, which is great for general performance analysis. However, it can miss small methods, and it can’t estimate how many times a function is called.
Tracing profilers, on the other hand, record every function entry and exit. This gives an exhaustive view of the application’s execution, useful for instance to evaluate algorithmic complexity or to analyze call patterns. But they introduce a fixed overhead per function call, which leads to greatly overestimating the time spent in small leaf functions, making it unsuitable for performance analysis.
This is sorts of the Heisenberg uncertainty principle applied to profilers: you can accurately measure the execution time of a method or the number of times it’s called, but you can’t do both at the same time.
Jetbrains dotTrace is an example of profiler that supports both modes, allowing to switch according to your needs.
Function hooks in .NET profilers
To support tracing profilers and similar use-cases, the .NET profiler API exposes the SetEnterLeaveFunctionHooks method (and its SetEnterLeaveFunctionHooks2, SetEnterLeaveFunctionHooks3, and SetEnterLeaveFunctionHooks3WithInfo variants). These methods allow you to register three callbacks, which will be called whenever a function is entered, exited, or during a tailcall. To minimize the overhead of those callbacks, the JIT does not save the CPU registers before calling them like it would for a normal function call. This means that the callbacks need to be written in a specific way, either in assembly or using special calling conventions if the language and compiler supports them (VC++ for instance supports declspec(naked) on x86 but not on x64).
At this point, you may be starting to see the problem for Silhouette: .NET completely abstracts the notion of registers (well, almost completely), so there is no way to write such low-level code in C#. Any solution will necessarily involve a stub written in assembly that saves the registers and forwards the call to managed code.
Originally, I thought there were only two possible paths:
- Pre-compile the assembly stubs for each architecture, store the data as binary, and expose them in dynamically allocated memory at runtime. This would work on principle, but it’s a pain to maintain and .NET has started to support security features like W^X that could make it even trickier to support.
- Compile the stubs into a separate DLL and load it at runtime. It’s much simpler but it means that the profiler can no longer be shipped as a single DLL, which is slightly annoying.
While prototyping the second solution, I realized that NativeAOT actually supported static linking, which would mitigate the drawback.
Most .NET developers probably aren’t familiar with the concept of dynamic vs static linking. Dynamic linking is what is typically used in .NET: the external code is shipped as a DLL and loaded at runtime. With static linking, the external code is compiled into a static library and embedded directly into the final binary at compile time, as if they were a single project from the beginning.
Creating the static library
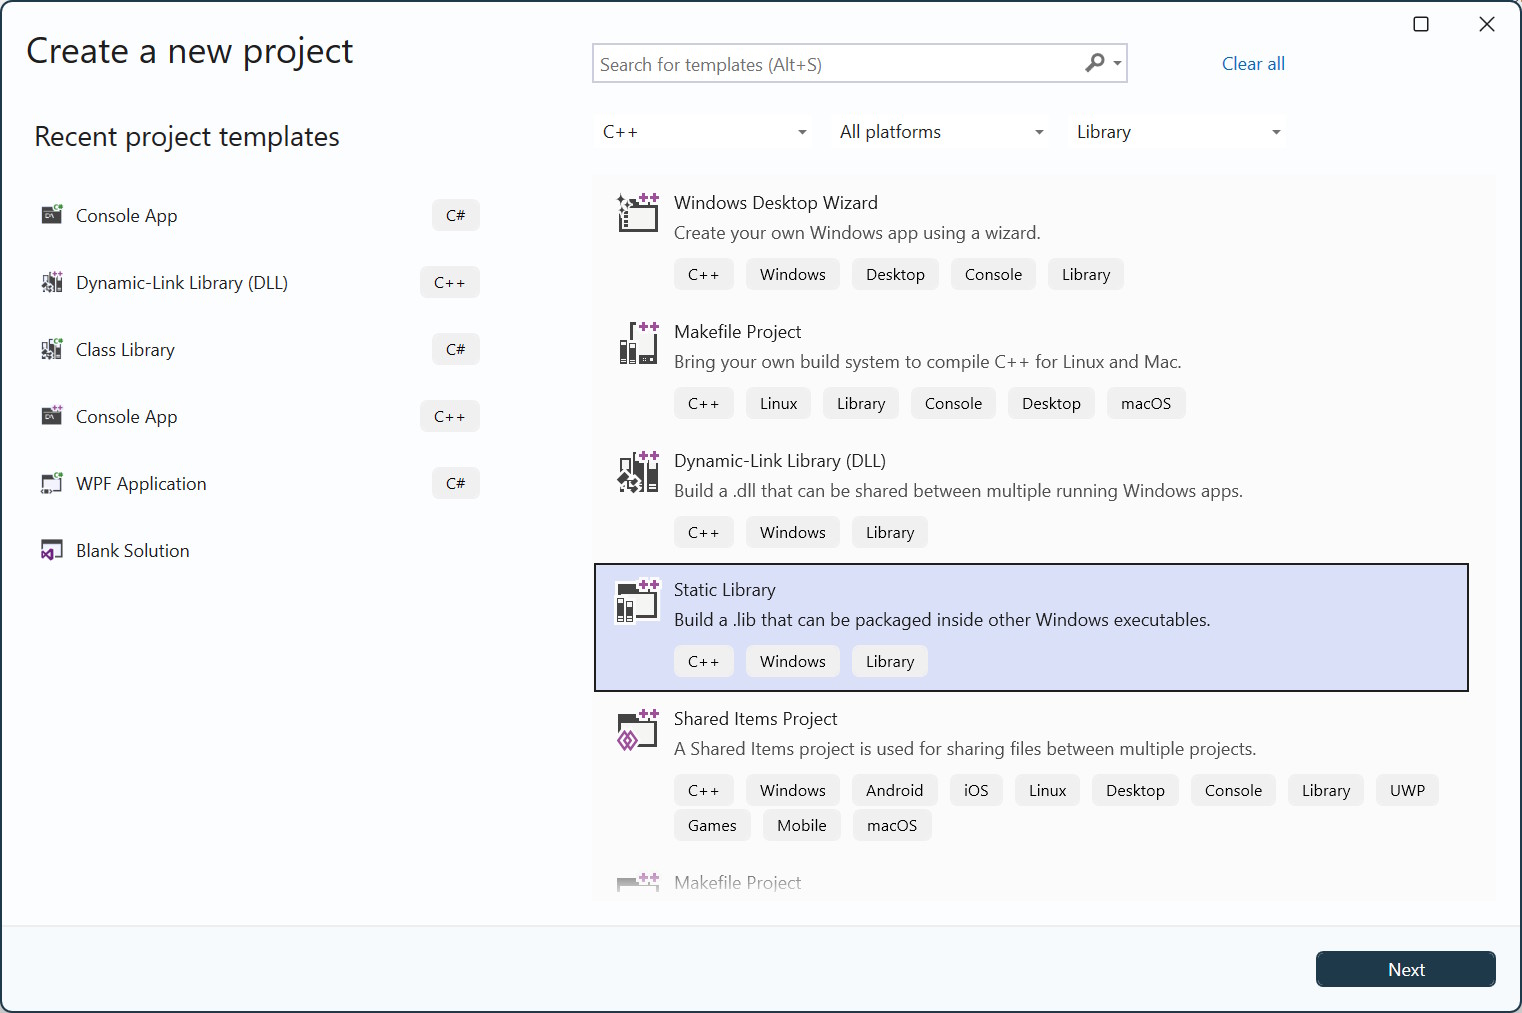
The first step is to create the static lib that will contain the assembly stubs. Maybe at some point I will ship them directly with Silhouette, but for now they need to be provided externally. Fortunately, Microsoft has already done most of the job for x64 in their clr-samples repository, so we just have to download the asmhelpers.asm file and put it in a new C++ “Static Library” project.
We set the project to use the x64 architecture, and add those lines to the vcxproj file (make sure to adapt the path to your asmhelpers.asm file):
  <ImportGroup Label="ExtensionSettings">
    <Import Project="$(VCTargetsPath)\BuildCustomizations\masm.props" />
  </ImportGroup>
  <ItemGroup>
    <MASM Include="asm/asmhelpers.asm" Condition="'$(Platform)' == 'x64'" />
  </ItemGroup>
  <ImportGroup Label="ExtensionTargets">
    <Import Project="$(VCTargetsPath)\BuildCustomizations\masm.targets" />
  </ImportGroup>
Then, in a C++ file, we can declare EnterStub, LeaveStub, and TailcallStub functions that will be automatically called by the assembly hooks. We also declare a RegisterCallbacks function that will be called from C# to register the managed callbacks. We will call them in the implementation of the EnterStub, LeaveStub, and TailcallStub functions.
#include "pch.h"

// Type definitions expected by the profiler API
typedef UINT_PTR FunctionID;
typedef union { FunctionID functionID; UINT_PTR clientID; } FunctionIDOrClientID;
typedef UINT_PTR COR_PRF_ELT_INFO;

// The assembly stubs declared in asmhelpers.asm
extern "C" {
	void EnterNaked();
	void LeaveNaked();
	void TailcallNaked();
}

// The managed callbacks that will be provided at runtime
namespace {
	void* enterCallback;
	void* leaveCallback;
	void* tailcallCallback;
}

// This is the function that will be called from the managed side to register the managed callbacks
EXTERN_C __declspec(dllexport) void __stdcall RegisterCallbacks(void** enter, void** leave, void** tailcall)
{
	if (enter) {
		enterCallback = *enter;
		*enter = reinterpret_cast<void*>(&EnterNaked);
	}

	if (leave) {
		leaveCallback = *leave;
		*leave = reinterpret_cast<void*>(&LeaveNaked);
	}

	if (tailcall) {
		tailcallCallback = *tailcall;
		*tailcall = reinterpret_cast<void*>(&TailcallNaked);
	}
}

EXTERN_C void STDMETHODCALLTYPE EnterStub(FunctionIDOrClientID functionId, COR_PRF_ELT_INFO eltInfo)
{
	if (enterCallback) {
		auto callback = reinterpret_cast<void (STDMETHODCALLTYPE *)(FunctionIDOrClientID, COR_PRF_ELT_INFO)>(enterCallback);
		callback(functionId, eltInfo);
	}
}

EXTERN_C void STDMETHODCALLTYPE LeaveStub(FunctionID functionId, COR_PRF_ELT_INFO eltInfo)
{
	if (leaveCallback) {
		auto callback = reinterpret_cast<void (STDMETHODCALLTYPE *)(FunctionID, COR_PRF_ELT_INFO)>(leaveCallback);
		callback(functionId, eltInfo);
	}
}

EXTERN_C void STDMETHODCALLTYPE TailcallStub(FunctionID functionId, COR_PRF_ELT_INFO eltInfo)
{
	if (tailcallCallback) {
		auto callback = reinterpret_cast<void (STDMETHODCALLTYPE *)(FunctionID, COR_PRF_ELT_INFO)>(tailcallCallback);
		callback(functionId, eltInfo);
	}
}
When compiling, this will produce a .lib file, we will now see how to integrate it into the Silhouette profiler.
Writing the profiler
There is already an article that explains how to setup a basic Silhouette profiler, so I will skip over that part. In the csproj project file, we must add those lines to statically link the .lib file we just created:
<ItemGroup>
  <DirectPInvoke Include="__Internal" />
    <NativeLibrary Include="$(MSBuildProjectDirectory)\..\x64\Release\FunctionEnterLeaveCallbacks.lib" />
</ItemGroup>
NativeLibrary is the path to the library that will be statically linked. DirectPInvoke is used to declare a “fake” library name that will be used to p/invoke into the static library. We can then declare our RegisterCallbacks function in C#:
[DllImport("__Internal")]
private static extern void RegisterCallbacks(ref IntPtr enter, ref IntPtr leave, ref IntPtr tailCall);
Then we write our managed callbacks. Since they will be called from native code, they must be decorated with the UnmanagedCallersOnly attribute. Because they have to be static, we redirect the calls to our instance of CorProfilerCallback by using a singleton:
[UnmanagedCallersOnly]
private static void FunctionEnterCallback(FunctionId functionId, IntPtr eltInfo)
{
    Instance.FunctionEnter(functionId, eltInfo);
}

[UnmanagedCallersOnly]
private static void FunctionLeaveCallback(FunctionId functionId, IntPtr eltInfo)
{
    Instance.FunctionLeave(functionId, eltInfo);
}
In the Initialize method of our profiler, we can then register the callbacks. We also call ICorProfilerInfo.SetEventMask to enable enter/leave callbacks:
    private static CorProfiler Instance;

    protected override HResult Initialize(int iCorProfilerInfoVersion)
    {
	    if (iCorProfilerInfoVersion < 13)
        {
            Console.WriteLine($"This profiler requires ICorProfilerInfo13 ({iCorProfilerInfoVersion})");
            return HResult.E_FAIL;
        }

        Instance = this;

        var functionEnter = (IntPtr)(delegate* unmanaged<FunctionId, IntPtr, void>)&FunctionEnterCallback;
        var functionLeave = (IntPtr)(delegate* unmanaged<FunctionId, IntPtr, void>)&FunctionLeaveCallback;
        var functionTailCall = IntPtr.Zero; // Not used for this example

        RegisterCallbacks(ref functionEnter, ref functionLeave, ref functionTailCall);

        var eventMask = COR_PRF_MONITOR.COR_PRF_MONITOR_ENTERLEAVE
            | COR_PRF_MONITOR.COR_PRF_ENABLE_FUNCTION_ARGS
            | COR_PRF_MONITOR.COR_PRF_ENABLE_FUNCTION_RETVAL
            | COR_PRF_MONITOR.COR_PRF_ENABLE_FRAME_INFO;

        var result = ICorProfilerInfo5.SetEventMask2(eventMask, COR_PRF_HIGH_MONITOR.COR_PRF_HIGH_MONITOR_NONE);

        if (!result)
        {
            Console.WriteLine($"SetEventMask2 failed with {result}");
            return result;
        }

        result = ICorProfilerInfo5.SetEnterLeaveFunctionHooks3WithInfo(functionEnter, functionLeave, functionTailCall);

        if (!result)
        {
            Console.WriteLine($"SetEnterLeaveFunctionHooks3WithInfo failed with {result}");
            return result;
        }

        return HResult.S_OK;
    }
Finally, we can implement the FunctionEnter and FunctionLeave methods to do something useful. In this example, we will just trace the function being executed, and display their name with proper indentation. To make the output readable, we limit it to the main thread (we retrieve the id of the main thread in the Initialize method by calling Environment.CurrentManagedThreadId).
private static int _mainThreadId; // Populated in Initialize
private static int _depth;

private void FunctionEnter(FunctionId functionId, IntPtr eltInfo)
{
    if (Environment.CurrentManagedThreadId == _mainThreadId)
    {
        var name = GetFunctionFullName(functionId);
        Console.WriteLine($"{new string(' ', _depth * 2)} - {name}");
        _depth++;
    }
}

private void FunctionLeave(FunctionId functionId, IntPtr eltInfo)
{
    if (Environment.CurrentManagedThreadId == _mainThreadId)
    {
        _depth--;
    }
}

private string GetFunctionFullName(FunctionId functionId)
{
    try
    {
        var functionInfo = ICorProfilerInfo2.GetFunctionInfo(functionId).ThrowIfFailed();
        var metaDataImport = ICorProfilerInfo2.GetModuleMetaDataImport(functionInfo.ModuleId, CorOpenFlags.ofRead).ThrowIfFailed();
        var methodProperties = metaDataImport.GetMethodProps(new MdMethodDef(functionInfo.Token)).ThrowIfFailed();
        var typeDefProps = metaDataImport.GetTypeDefProps(methodProperties.Class).ThrowIfFailed();

        return $"{typeDefProps.TypeName}.{methodProperties.Name}";
    }
    catch (Win32Exception ex)
    {
        return $"Failed ({ex.NativeErrorCode})";
    }
}
After compiling everything, we can test by attaching the profiler to a simple console application:
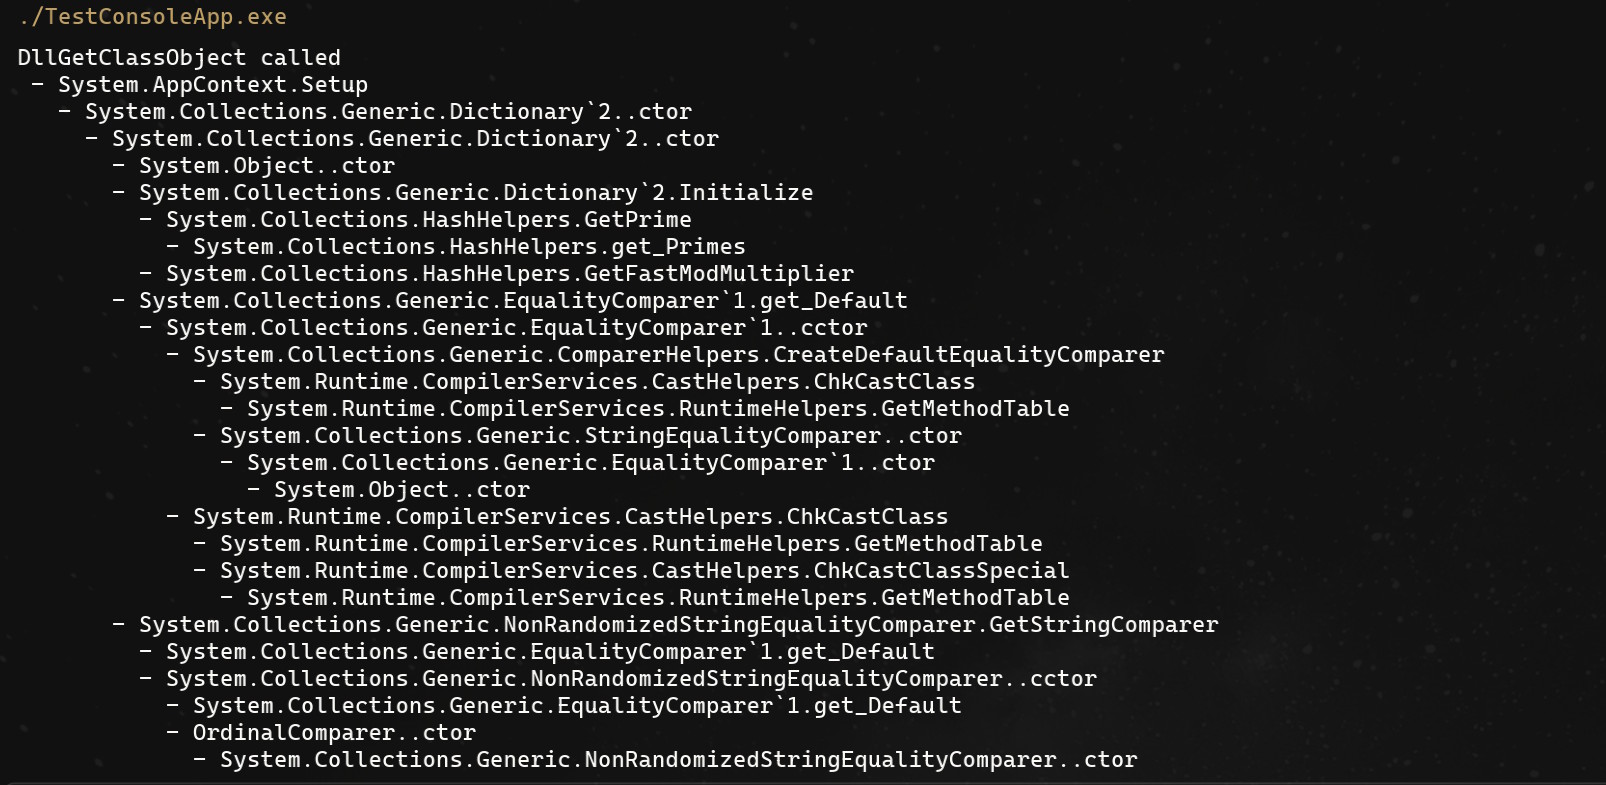
Here, we are just inspecting the name of the methods. Inspecting the arguments is much more convoluted. If you are interested by the topic, you can check that article by Christophe Nasarre, where he shows how to do it in C++.
The full source code of this article is available on GitHub.