AccessViolation in ObjectNative::IsLockHeld (part 2 of 2)
This is the second part of an investigation where I tried to understand why an application was randomly crashing with an AccessViolationException.
If you haven’t read it, you can find part 1 of the investigation here.
As a reminder, here is what we uncovered so far:
-
The server runs Orchard, with the Datadog .NET tracer, and crashes about once or twice per day
-
The crash dump indicated an access violation in method
clr!ObjectNative::IsLockHeld, itself called byOrchard.OutputCache.Filters.OutputCacheFilter.Dispose -
In WinDbg, the
!syncblkcommand failed with an error
Part 2 starts when, as I ran out of easy things to try, I decided to map the assembly code of the IsLockHeld method to the original C++ code to understand exactly where it crashed. But first I wanted to confirm with a new memory dump that the symptoms were identical, and fortunately a new crash occurred by the time I reached that point.
Into the second memory dump
At first glance, the new crash was identical to the first one: an access violation in clr!ObjectNative::IsLockHeld, trying to dereference the address 0x2B. Just like before, the method was called from OutputCacheFilter.Dipose. However, this time the !syncblk command ran without any error:
0:056> !syncblk
Index SyncBlock MonitorHeld Recursion Owning Thread Info  SyncBlock Owner
  217 0000023a1af311b8            1         1 0000023a1be46590 1070 101   00000236c7adf9d0 System.String
  788 0000023a1b09c438            1         1 0000000000000000     none    00000235c7d279b0 System.String
  989 0000023a1b9c0ed8            1         1 0000023a1c717030 1058  54   00000235c7d27858 System.String
One of the locks had no associated thread. After closer inspection of the OutputCacheFilter code, it became apparent that the lock was acquired in the OnActionExecuting event of the ASP.NET MVC framework, and released in the OnResultExecuted event. This could only work if both events were called from the same thread, and ASP.NET MVC does not make any guarantee about that. I concluded that we could end up with orphaned locks, and that would explain why a lock had no associated thread.
Still, that was bad but it didn’t explain the crash. So I decided to focus on the assembly code to understand where the wrong value came from.
The disassembly code, from the beginning of the method to the point where it failed, was:
 clr!ObjectNative::IsLockHeld:
00007ffb`62cb0a40 48895c2408     mov     qword ptr [rsp+8], rbx
00007ffb`62cb0a45 57             push    rdi
00007ffb`62cb0a46 4883ec20       sub     rsp, 20h
00007ffb`62cb0a4a 8b59fc         mov     ebx, dword ptr [rcx-4]
00007ffb`62cb0a4d bf01000000     mov     edi, 1
00007ffb`62cb0a52 0fbae31b       bt      ebx, 1Bh
00007ffb`62cb0a56 7340           jae     clr!ObjectNative::IsLockHeld+0x58 (00007ffb`62cb0a98)
00007ffb`62cb0a58 0fbae31a       bt      ebx, 1Ah
00007ffb`62cb0a5c 7306           jae     clr!ObjectNative::IsLockHeld+0x24 (00007ffb`62cb0a64)
00007ffb`62cb0a5e 33db           xor     ebx, ebx
00007ffb`62cb0a60 33c0           xor     eax, eax
00007ffb`62cb0a62 eb42           jmp     clr!ObjectNative::IsLockHeld+0x66 (00007ffb`62cb0aa6)
00007ffb`62cb0a64 488b055d402400 mov     rax, qword ptr [clr!g_pSyncTable (00007ffb`62ef4ac8)]
00007ffb`62cb0a6b 8bcb           mov     ecx, ebx
00007ffb`62cb0a6d 81e1ffffff03   and     ecx, 3FFFFFFh
00007ffb`62cb0a73 41b800000080   mov     r8d, 80000000h
00007ffb`62cb0a79 4803c9         add     rcx, rcx
00007ffb`62cb0a7c 488b14c8       mov     rdx, qword ptr [rax+rcx*8]
00007ffb`62cb0a80 44094214       or      dword ptr [rdx+14h], r8d
00007ffb`62cb0a84 488b4a08       mov     rcx, qword ptr [rdx+8]
00007ffb`62cb0a88 4885c9         test    rcx, rcx
00007ffb`62cb0a8b 74d1           je      clr!ObjectNative::IsLockHeld+0x1e (00007ffb`62cb0a5e)
00007ffb`62cb0a8d 8b592c         mov     ebx, dword ptr [rcx+2Ch] ds:00000000`0000002b=????????
The source code of IsLockHeld is:
FCIMPL1(FC_BOOL_RET, ObjectNative::IsLockHeld, Object* pThisUNSAFE)
{
    FCALL_CONTRACT;

    BOOL retVal;
    DWORD owningThreadId;
    DWORD acquisitionCount;

    //
    // If the lock is held, check if it's held by the current thread.
    //
    retVal = pThisUNSAFE->GetThreadOwningMonitorLock(&owningThreadId, &acquisitionCount);
    if (retVal)
        retVal = GetThread()->GetThreadId() == owningThreadId;

    FC_RETURN_BOOL(retVal);
}
How to proceed? As I mentioned in a previous article, the key is to find some kind of “anchor”, some easily-recognizable part in the assembly and work your way from there. The mov rax, qword ptr [clr!g_pSyncTable (00007ffb`62ef4ac8)] instruction was interesting, because it refers to g_pSyncTable. Unfortunately there was no such symbol in the IsLockHeld method, which probably meant that a method was inlined. So I needed to dig further into the source code. The first method called was GetThreadOwningMonitorLock, what did it look like?
BOOL ObjHeader::GetThreadOwningMonitorLock(DWORD *pThreadId, DWORD *pAcquisitionCount)
{
    // ...

    DWORD bits = GetBits();

    if (bits & BIT_SBLK_IS_HASH_OR_SYNCBLKINDEX)
    {
        if (bits & BIT_SBLK_IS_HASHCODE)
        {
            //
            // This thread does not own the lock.
            //
            *pThreadId = 0;
            *pAcquisitionCount = 0;
            return FALSE;
        }
        else
        {
            //
            // We have a syncblk
            //
            DWORD index = bits & MASK_SYNCBLOCKINDEX;
            SyncBlock* psb = g_pSyncTable[(int)index].m_SyncBlock;

            _ASSERTE(psb->GetMonitor() != NULL);
            Thread* pThread = psb->GetMonitor()->m_HoldingThread;
            if(pThread == NULL)
            {
                *pThreadId = 0;
                *pAcquisitionCount = 0;
                return FALSE;
            }
            else
            {
                *pThreadId = pThread->GetThreadId();
                *pAcquisitionCount = psb->GetMonitor()->m_Recursion;
                return TRUE;
            }
        }
    }
    else
    {
        //
        // We have a thinlock
        //

        // ...
    }
}
I removed some bits for brevity
That looked really good. The method did indeed use g_pSyncTable. Also, it started with two bit test operations, bits & BIT_SBLK_IS_HASH_OR_SYNCBLKINDEX and bits & BIT_SBLK_IS_HASHCODE, which mapped nicely to the bt ebx, 1Bh and bt ebx, 1Ah instructions. Just to be sure, I confirmed that the value of BIT_SBLK_IS_HASH_OR_SYNCBLKINDEX was 0x08000000, so to test that flag you would need to check the 28th bit (bt ebx, 1Bh). Likewise, BIT_SBLK_IS_HASHCODE was 0x04000000, so the 27th bit (bt ebx, 1Ah).
What else could I use to map to the original source code? The mov rax, qword ptr [clr!g_pSyncTable (00007ffb`62ef4ac8)] instruction was dereferencing g_pSyncTable into rax. Then mov rdx, qword ptr [rax+rcx*8] read the table at index rcx*8. This looked a lot like g_pSyncTable[(int)index]. Further down, test rcx, rcx looked like a null check, so probably if(pThread == NULL).
To confirm it, let’s look up a bit. The line just before the null check was:
Thread* pThread = psb->GetMonitor()->m_HoldingThread;
GetMonitor() returns m_Monitor, which is the first field of the syncblock (therefore located at the base address of the syncblock). m_Monitor is an AwareLock with the following structure:
    Volatile<LONG>  m_MonitorHeld;
    ULONG           m_Recursion;
    PTR_Thread      m_HoldingThread;
Both LONG and ULONG are 4 bytes wide, so m_holdingThread would be at offset 8, which was consistent with the mov rcx, qword ptr [rdx+8] instruction. So at this point it seemed reasonable to assume that the code was failing at the *pThreadId = pThread->GetThreadId(); instruction. GetThreadId returned the m_ThreadId field of the thread. Given that the crash occurred when dereferencing mov ebx, dword ptr [rcx+2Ch], I could have the definite confirmation if m_ThreadId was located at offset 2C of the Thread class. The layout of the Thread class is:
    Volatile<ThreadState> m_State;   // Bits for the state of the thread
    Volatile<ULONG>       m_fPreemptiveGCDisabled;
    PTR_Frame             m_pFrame;  // The Current Frame
    PTR_Frame             m_pUnloadBoundaryFrame;
    PTR_AppDomain         m_pDomain;
    DWORD                 m_dwLockCount;
    DWORD                 m_ThreadId;
Let’s count:
-
ThreadStateis an enum (4 bytes) -
ULONG: 4 bytes -
PTR_*objects are pointer to an object, so 8 bytes each (64 bits process) -
DWORD: 4 bytes
4 + 4 + (3 * 8) + 4 = 36
Offset 2C would be 44 in decimal, so we’re missing 8 bytes! Did I miss something?
Actually, yes: the signature of the Thread class.
class Thread: public IUnknown
Thread inherits from IUnknown, which declares virtual methods. It means that Thread has a vtable, and the pointer of the vtable is stored at the beginning of the objects. That’s the missing 8 bytes!
Now if we take the vtable into account: 8 + 4 + 4 + (3 * 8) + 4 = 44 = 2C
So I could conclude that the crash occurred at the *pThreadId = pThread->GetThreadId(); line, which meant that for some reason pThread was 0xffffffff. Could I confirm that from the memory dump?
Following my previous analysis, mov rdx, qword ptr [rax+rcx*8] was reading the syncblock from the synctable and storing the address into rdx. Since the register was untouched past this point, I could expect that the value would still be there.
0:102> r rdx
rdx=0000020c6dd4ec38
Inspecting the register gave me the value 0000020c6dd4ec38. I then dumped the value of all syncblocks and…
0:102> !syncblk -all
Index SyncBlock MonitorHeld Recursion Owning Thread Info  SyncBlock Owner
    1 0000000000000000            0         0 0000000000000000     none           0 Free
    2 0000020c67f1c728            0         0 0000000000000000     none    000002091a191da0 System.__ComObject
 [...]
 1069 0000020c6dd4ec38            1         1 0000000000000000     none    000002081ad5e178 System.String
 [...]
 1279 0000020c6e81de08            0         0 0000000000000000     none    000002091da1e320 System.Data.SqlClient.SqlCommand
 1280 0000020c67f1cd68            0         0 0000000000000000     none    000002081d534ed8 System.Data.SqlClient.SqlCommand
Score! The syncblock at index 1069 had the same address, 0000020c6dd4ec38. As mentioned earlier, the first field of a syncblock is an AwareLock with the following structure:
    Volatile<LONG>  m_MonitorHeld;
    ULONG           m_Recursion;
    PTR_Thread      m_HoldingThread;
So if we dump the memory at the address 0000020c6dd4ec38, we can map the values accordingly:
0:102> dd 0000020c6dd4ec38
0000020c`6dd4ec38  00000001 00000001 ffffffff ffffffff
-
m_MonitorHeld= 1 -
m_Recursion= 1 -
m_HoldingThread=ffffffff`ffffffff
At this point there was no doubt left that the thread address associated to the syncblock was ffffffff`ffffffff, and this caused the crash. The next step was finding how this value ended up there.
ffffffff`ffffffff is a very remarkable value, equal to -1. So I scanned through the CLR source code to find where the -1 value was assigned to the m_HoldingThread field of the syncblock. Luckily there was only one place, in ObjHeader::GetSyncBlock(). This piece of code gets executed when a thin-lock is promoted to a syncblock (you can refer to part 1 of the article for a refresher on thin locks) :
Thread *pThread = g_pThinLockThreadIdDispenser->IdToThreadWithValidation(lockThreadId);

if (pThread == NULL)
{
    // The lock is orphaned.
    pThread = (Thread*) -1;
}
syncBlock->InitState();
syncBlock->SetAwareLock(pThread, recursionLevel + 1);
The The lock is orphaned comment was very encouraging, as I already knew that Orchard was orphaning locks. But not all orphaned lock cause a crash, so I was still missing a piece of the puzzle.
The thread address came from g_pThinLockThreadIdDispenser->IdToThreadWithValidation. Upon further inspection, it looked like a table to convert some kind of thread ids to addresses. What kind of ids?
Thread *IdToThreadWithValidation(DWORD id)
{
    WRAPPER_NO_CONTRACT;

    CrstHolder ch(&m_Crst);

    Thread *result = NULL;
    if (id <= m_highestId)
        result = m_idToThread[id];
    // m_idToThread may have Thread*, or the next free slot
    if ((size_t)result <= m_idToThreadCapacity)
        result = NULL;
    _ASSERTE(result == NULL || ((size_t)result & 0x3) == 0 || ((Thread*)result)->GetThreadId() == id);
    return result;
}
If you remember from part 1, thin locks store the information in the object header. Headers are 32 bits wide, and contain only 26 bits of usable space for the thin lock. Monitors need to keep track of the owning thread, for instance to allow recursive access. How to store that information in 26 bits? That’s not enough for the thread address, so instead the runtime stores the managed thread id and maintains a table to map that id back to the address of the thread object. That table is g_pThinLockThreadIdDispenser.
Back to our ObjHeader::GetSyncBlock() method, it meant that -1 was used as a fallback value for the thread address when the thread id couldn’t be found in the table. So the last missing bit was to figure out when ids are removed from that table.
After more time spent reading the CLR code, I concluded that the table was cleaned by the finalizer of the thread object. At that point, I had all the pieces of the puzzle and could write a small repro:
static void Main(string[] args)
{
    var locks = new object[4];

    for (int i = 0; i < locks.Length; i++)
    {
        locks[i] = new object();
    }

    for (int i = 0; i < 4; i++)
    {
        var thread = new Thread(state =>
        {
            Monitor.Enter(locks[(int)state]);
        });

        thread.Start(i);
        thread.Join();
    }

    // Force the thread to be collected, orphaning the lock
    GC.Collect(2, GCCollectionMode.Forced, true, true);
    GC.WaitForPendingFinalizers();
    GC.Collect(2, GCCollectionMode.Forced, true, true);

    // Promote to a syncblock
    for (int i = 0; i < locks.Length; i++)
    {
        _ = locks[i].GetHashCode();
    }

    // Trigger the crash
    for (int i = 0; i < 4; i++)
    {
        var thread = new Thread(state =>
        {
            _ = Monitor.IsEntered(locks[(int)state]);
        });

        thread.Start(i);
        thread.Join();
    }
}
The program starts by creating a bunch of objects, then starts threads to lock on those objects. At that point, a thin lock is used and the thread ids are added to the g_pThinLockThreadIdDispenser table. Then the GC is triggered, which causes the thread finalizers to run, which in turn will remove the thread ids from the table. Line 27, a loop call GetHashCode on the objects, forcing the thin locks to be promoted to syncblocks. While doing so, the runtime will try to fetch the thread addresses from the table, but won’t find them since they were removed by the finalizers. Instead, the runtime will store the -1 fallback value in the syncblocks. Finally, the loop line 33 starts new threads and make them inspect the state of the lock. This causes the runtime to dereference the thread addresses stored in the syncblocks (that is, -1) and triggers the AccessViolationException.
Wrapping things up
This is a runtime bug, that has probably been around for a very long time. I’ve reported it on Github, so it may be fixed in time for .NET 6.0. Still, there were a few questions left:
-
If orphaned locks could trigger a crash, how come the Orchard maintainers never noticed it?
-
At Datadog we have a test server running our instrumentation code, and a control server running without. If that was a runtime bug, why did we detect it on the test server but not on the control server?
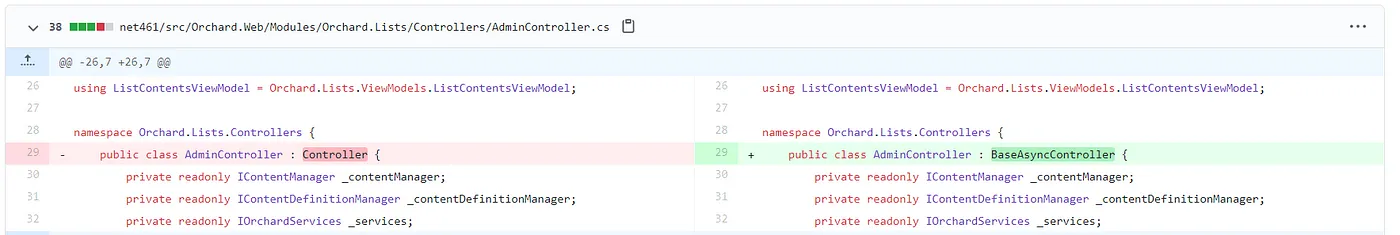
The reason for 1/ was simply that we weren’t running vanilla Orchard. The locking scheme used by Orchard relies on the assumption that ASP.NET MVC will execute the OnActionExecuting and OnResultExecuted events in the same thread. This is actually true when using synchronous controllers. But to better test our code, we added some asynchronous workload to Orchard, and therefore switched to asynchronous controllers to follow best practices. This broke the assumption.
 We were just following best practices :(
For 2/, I must commend the intuition of OzCode’s Omer Raviv, who sensed immediately after reading part 1 that something was fishy:
Really fascinating! The one thing I found missing from this crime novel is - how does your test server work? What type of load does it do? Does it run 24/7? Very particular that it happened just once a day.
— Omer Raviv (@omerraviv) November 11, 2020
Remember that the crash is caused by some error condition that has a probability of happening every time an orphaned lock is promoted. The locks in question are used by Orchard to update its internal cache. Orchard has a finite number of caches, and therefore a finite number of locks. Once all of them are orphaned, the conditions for the crash will never happen again. Put another way: every time the application restarted, it had some probability of crashing in the following minutes. Past that window, the crash could not happen again because the locks for all the caches would have been orphaned. The test server was redeployed every time a new change was merged in our GitHub repository, that is a few times per day. On the other hand, the control server was almost never restarted. So what caused the test server to crash wasn’t the fact that our code was running on it, but simply that it was restarted more often.