Investigating an InvalidProgramException from a memory dump (part 2 of 3)
In this series of articles, we’re retracing how I debugged an InvalidProgramException, caused by a bug in the Datadog profiler, from a memory dump sent by a customer.
-
Part 2: Finding the generated IL
Let’s start with a quick reminder. The profiler works by rewriting the IL of interesting methods to inject instrumentation code. The InvalidProgramException is thrown by the JIT when trying to compile the IL emitted by the profiler, which must be somehow invalid. The first part was about identifying in what method the exception was thrown, and I ended up concluding that Npgsql.PostgresDatabaseInfo.LoadBackendTypes was the culprit. The second part is going to be about how to find the generated IL for that method.
Finding the generated IL
Npgsql.PostgresDatabaseInfo.LoadBackendTypes is an asynchronous method. The logic of an async method is stored in the MoveNext method of its state-machine, so that’s the one I was interested in.
There’s a function in dotnet-dump to display the IL of a method: dumpil. This method requires the MethodDescriptor (MD) of the target method, so I needed to find it for MoveNext.
I started by dumping all the types in the module, using the dumpmodule -mt command, to find the state-machine:
> dumpmodule -mt 00007FCF13EC67D8

Name: /Npgsql.dll
Attributes:              PEFile SupportsUpdateableMethods IsFileLayout
Assembly:                0000000002a3f590
BaseAddress:             00007FCF8079E000
PEFile:                  0000000002A638B0
ModuleId:                00007FCF13EC7FE0
ModuleIndex:             0000000000000091
LoaderHeap:              0000000000000000
TypeDefToMethodTableMap: 00007FCF13F30020
TypeRefToMethodTableMap: 00007FCF13F31270
MethodDefToDescMap:      00007FCF13F31EE8
FieldDefToDescMap:       00007FCF13F392E0
MemberRefToDescMap:      0000000000000000
FileReferencesMap:       00007FCF13F3F740
AssemblyReferencesMap:   00007FCF13F3F748
MetaData start address:  00007FCF807DF410 (496736 bytes)

Types defined in this module

              MT          TypeDef Name
------------------------------------------------------------------------------
00007fcf161d7698 0x02000002 <>f__AnonymousType0`2
00007fcf161d7bb0 0x02000003 <>f__AnonymousType1`2
[...]
00007fcf16509c10 0x020001b0 Npgsql.PostgresDatabaseInfo+<LoadBackendTypes>d__16
[...]
This gave me the MT (MethodTable) of the state-machine type: 00007fcf16509c10. Then I fed it to the dumpmt -md command to get the MD:
> dumpmt -md 00007fcf16509c10

EEClass:         00007FCF164EBD70
Module:          00007FCF13EC67D8
Name:            Npgsql.PostgresDatabaseInfo+<LoadBackendTypes>d__16
mdToken:         00000000020001B0
File:            /Npgsql.dll
BaseSize:        0x60
ComponentSize:   0x0
DynamicStatics:  false
ContainsPointers true
Slots in VTable: 8
Number of IFaces in IFaceMap: 1
--------------------------------------
MethodDesc Table
           Entry       MethodDesc    JIT Name
[...]
00007FCF16265300 00007FCF16509B58   NONE Npgsql.PostgresDatabaseInfo+<LoadBackendTypes>d__16.MoveNext()
[...]
The command outputs all the methods from the given type, and from there we can see that our MD is 00007FCF16509B58.
Unfortunately, the dumpil command returned the original IL, not the rewritten one. Looking for ideas, I used the dumpmd command to get more information about the method:
> dumpmd 00007FCF16509B58

Method Name:          Npgsql.PostgresDatabaseInfo+<LoadBackendTypes>d__16.MoveNext()
Class:                00007fcf164ebd70
MethodTable:          00007fcf16509c10
mdToken:              0000000006000D24
Module:               00007fcf13ec67d8
IsJitted:             no
Current CodeAddr:     ffffffffffffffff
Version History:
  ILCodeVersion:      0000000000000000
  ReJIT ID:           0
  IL Addr:            0000000000000000
     CodeAddr:           0000000000000000  (OptimizedTier1)
     NativeCodeVersion:  00007FCE84156100
     CodeAddr:           0000000000000000  (QuickJitted)
     NativeCodeVersion:  0000000000000000
Interestingly, the method was marked as not jitted. In hindsight, that makes sense. We rewrite the method using the JitCompilationStarted event of the profiler API. The JIT then tries to compile it, fails, and throws away the rewritten IL.
Fun fact for those who know about tiered compilation: you may have noticed in the
dumpmdoutput that there are two versions of the method, QuickJitted and OptimizedTier1, despite theIsJittedflag being false. I managed to reproduce this on a test app with a profiler emitting bad IL: after calling the method 30 times, the tiered JIT promotes it to tier 1, even though the method was never jitted successfully
Dead-end? I really didn’t want to give up after going through the tedious process of finding the method, so I decided to get creative. The same way that I managed to find the InvalidProgramException on the heap even though it wasn’t referenced anymore, I figured out that there could still be traces of the generated IL somewhere.
To give the rewritten IL to the JIT, the profiler uses the SetILFunctionBody API. What’s interesting about it is that the buffer, used to write the IL, is provided by the JIT own’s allocator. Quoting the documentation:
Use the ICorProfilerInfo::GetILFunctionBodyAllocator method to allocate space for the new method to ensure that the buffer is compatible.
Maybe I could find traces of the IL in whatever data structure is used internally by the body allocator? Unfortunately, the allocator is just a call to the new operator:
//---------------------------------------------------------------------------------------
// Profiler entrypoint to allocate space from this module's heap.
//
// Arguments
//      cb - size in bytes of allocation request
//
// Return value
//      pointer to allocated memory, or NULL if there was an error

void * STDMETHODCALLTYPE ModuleILHeap::Alloc(ULONG cb)
{
    CONTRACTL
    {
        // Yay!
        NOTHROW;

        // (see GC_TRIGGERS comment below)
        CAN_TAKE_LOCK;

        // Allocations using loader heaps below enter a critsec, which switches
        // to preemptive, which is effectively a GC trigger
        GC_TRIGGERS;

        // Yay!
        MODE_ANY;

    }
    CONTRACTL_END;

    LOG((LF_CORPROF, LL_INFO1000, "**PROF: ModuleILHeap::Alloc 0x%08xp.\n", cb));

    if (cb == 0)
    {
        return NULL;
    }

    return new (nothrow) BYTE[cb];
}
I have no clue how the new operator works in C++, so I decided to follow another lead. What happens to that buffer after it’s given to the SetILFunctionBody method? I’m not going to show the method implementation, but the interesting bit is how it ends up calling Module::SetDynamicIL. In turn, SetDynamicIL stores the IL body in an internal table (this time I’m showing the implementation because it’ll be important for later):
void Module::SetDynamicIL(mdToken token, TADDR blobAddress, BOOL fTemporaryOverride)
{
    DynamicILBlobEntry entry = {mdToken(token), TADDR(blobAddress)};

    // Lazily allocate a Crst to serialize update access to the info structure.
    // Carefully synchronize to ensure we don't leak a Crst in race conditions.
    if (m_debuggerSpecificData.m_pDynamicILCrst == NULL)
    {
        InitializeDynamicILCrst();
    }

    CrstHolder ch(m_debuggerSpecificData.m_pDynamicILCrst);

    // Figure out which table to fill in
    PTR_DynamicILBlobTable &table(fTemporaryOverride ? m_debuggerSpecificData.m_pTemporaryILBlobTable
                                                     : m_debuggerSpecificData.m_pDynamicILBlobTable);

    // Lazily allocate the hash table.
    if (table == NULL)
    {
        table = PTR_DynamicILBlobTable(new DynamicILBlobTable);
    }
    table->AddOrReplace(entry);
}
fTemporaryOverride is false in this codepath, so m_debuggerSpecificData.m_pDynamicILBlobTable is used to store the IL. If I could find the address of that table in the memory dump, then maybe I could retrieve the generated IL!
As I shown in a previous article, it’s possible to export all the symbols of a module on Linux by using the nm command. So I tried looking for m_debuggerSpecificData, but no luck:
$ nm -C libcoreclr.so | grep m_debuggerSpecificData
$
How could I possibly find this structure without symbols?
I firmly believe that debugging is a creative process. So I took a step back and started thinking. When Module::SetDynamicIL is called, the runtime is capable, somehow, of locating that structure. So the answer, whatever it is, must be somewhere in the assembly code of that method.
Reading this article makes it sound like it’s an instantaneous process, but locating
m_debuggerSpecificDatawithout symbols is the result of 2 hours of trial and error and bouncing ideas back and forth with my coworkers Christophe Nasarre and Gregory Leocadie In the process, I also discovered that a ISOSDacInterface7 is being implemented for .NET 5, and it has all the facilities I needed to find the dynamic IL. sigh
Fortunately, that method is exported in the symbols:
$ nm -C libcoreclr.so | grep Module::SetDynamicIL
0000000000543da0 t Module::SetDynamicIL(unsigned int, unsigned long, int)
I used gdb to decompile it:
$ gdb ./libcoreclr.so -batch -ex "set disassembly-flavor intel" -ex "disassemble Module::SetDynamicIL"

Dump of assembler code for function Module::SetDynamicIL(unsigned int, unsigned long, int):
   0x26bf00 <+0>:     push   rbp
   0x26bf01 <+1>:     mov    rbp,rsp
   0x26bf04 <+4>:     push   r15
   0x26bf06 <+6>:     push   r14
   0x26bf08 <+8>:     push   rbx
   0x26bf09 <+9>:     sub    rsp,0x18
   0x26bf0d <+13>:    mov    r15d,ecx
   0x26bf10 <+16>:    mov    rbx,rdi
   0x26bf13 <+19>:    mov    rax,QWORD PTR fs:0x28
   0x26bf1c <+28>:    mov    QWORD PTR [rbp-0x20],rax
   0x26bf20 <+32>:    mov    DWORD PTR [rbp-0x30],esi
   0x26bf23 <+35>:    mov    QWORD PTR [rbp-0x28],rdx
   0x26bf27 <+39>:    mov    r14,QWORD PTR [rbx+0x568]
   0x26bf2e <+46>:    test   r14,r14
   0x26bf31 <+49>:    jne    0x26bf42 <Module::SetDynamicIL(unsigned int, unsigned long, int)+66>
   0x26bf33 <+51>:    mov    rdi,rbx
   0x26bf36 <+54>:    call   0x26be90 <Module::InitializeDynamicILCrst()>
   0x26bf3b <+59>:    mov    r14,QWORD PTR [rbx+0x568]
   0x26bf42 <+66>:    mov    rdi,r14
   0x26bf45 <+69>:    call   0xcf150 <CrstBase::Enter()>
   0x26bf4a <+74>:    lea    rax,[rbx+0x578]
   0x26bf51 <+81>:    add    rbx,0x570
   0x26bf58 <+88>:    test   r15d,r15d
   0x26bf5b <+91>:    cmovne rbx,rax
   0x26bf5f <+95>:    mov    rdi,QWORD PTR [rbx]
   0x26bf62 <+98>:    test   rdi,rdi
   0x26bf65 <+101>:   jne    0x26bf85 <Module::SetDynamicIL(unsigned int, unsigned long, int)+133>
   0x26bf67 <+103>:   mov    edi,0x18
   0x26bf6c <+108>:   call   0xa4100 <operator new(unsigned long)>
   0x26bf71 <+113>:   mov    rdi,rax
   0x26bf74 <+116>:   xorps  xmm0,xmm0
   0x26bf77 <+119>:   movups XMMWORD PTR [rdi],xmm0
   0x26bf7a <+122>:   mov    QWORD PTR [rdi+0x10],0x0
   0x26bf82 <+130>:   mov    QWORD PTR [rbx],rdi
   0x26bf85 <+133>:   lea    rsi,[rbp-0x30]
   0x26bf89 <+137>:   call   0x2768b0 <SHash<DynamicILBlobTraits>::AddOrReplace(DynamicILBlobEntry const&)>
   0x26bf8e <+142>:   mov    rdi,r14
   0x26bf91 <+145>:   call   0xcf0c0 <CrstBase::Leave()>
   0x26bf96 <+150>:   mov    rax,QWORD PTR fs:0x28
   0x26bf9f <+159>:   cmp    rax,QWORD PTR [rbp-0x20]
   0x26bfa3 <+163>:   jne    0x26bfb0 <Module::SetDynamicIL(unsigned int, unsigned long, int)+176>
   0x26bfa5 <+165>:   add    rsp,0x18
   0x26bfa9 <+169>:   pop    rbx
   0x26bfaa <+170>:   pop    r14
   0x26bfac <+172>:   pop    r15
   0x26bfae <+174>:   pop    rbp
   0x26bfaf <+175>:   ret
   0x26bfb0 <+176>:   call   0xa0ac0 <__stack_chk_fail@plt>
   0x26bfb5 <+181>:   mov    rdi,rax
   0x26bfb8 <+184>:   call   0xa3eb0 <__clang_call_terminate>
   0x26bfbd <+189>:   mov    rbx,rax
   0x26bfc0 <+192>:   mov    rdi,r14
   0x26bfc3 <+195>:   call   0xcf0c0 <CrstBase::Leave()>
   0x26bfc8 <+200>:   mov    rdi,rbx
   0x26bfcb <+203>:   call   0xa0af0 <_Unwind_Resume@plt>
   0x26bfd0 <+208>:   mov    rdi,rax
   0x26bfd3 <+211>:   call   0xa3eb0 <__clang_call_terminate>
OK, that’s a lot to process. Especially if, like me, you’re not that familiar with native disassembly. The trick is to compare it with the original source code (that’s why I posted SetDynamicIL earlier), and focus exclusively on what you’re looking for.
First, we need to locate the this parameter. Object-oriented programming does not exist at the assembly level, so the this pointer that we magically use must be given to the target function somehow. By convention, when calling an instance method, this is the first argument of the function.
Next, we need to know how arguments are given to the function. Calling Wikipedia to the rescue, we learn that Linux uses the “System V AMD64 ABI” calling convention. In that convention, the first argument of a function is stored in the rdi register.
Now we need some kind of “anchor”. A well-identified point within the function that we can focus on. Right at the beginning of SetDynamicIL, we find this condition:
    if (m_debuggerSpecificData.m_pDynamicILCrst == NULL)
    {
        InitializeDynamicILCrst();
    }
This is great because it uses m_debuggerSpecificData (the field we’re looking for), it has a condition, and it calls a method (InitializeDynamicILCrst). This makes it very easy to spot in the disassembly. Now we know we have to focus on this bit:
   0x26bf00 <+0>:     push   rbp
   0x26bf01 <+1>:     mov    rbp,rsp
   0x26bf04 <+4>:     push   r15
   0x26bf06 <+6>:     push   r14
   0x26bf08 <+8>:     push   rbx
   0x26bf09 <+9>:     sub    rsp,0x18
   0x26bf0d <+13>:    mov    r15d,ecx
   0x26bf10 <+16>:    mov    rbx,rdi
   0x26bf13 <+19>:    mov    rax,QWORD PTR fs:0x28
   0x26bf1c <+28>:    mov    QWORD PTR [rbp-0x20],rax
   0x26bf20 <+32>:    mov    DWORD PTR [rbp-0x30],esi
   0x26bf23 <+35>:    mov    QWORD PTR [rbp-0x28],rdx
   0x26bf27 <+39>:    mov    r14,QWORD PTR [rbx+0x568]
   0x26bf2e <+46>:    test   r14,r14
   0x26bf31 <+49>:    jne    0x26bf42 <Module::SetDynamicIL(unsigned int, unsigned long, int)+66>
   0x26bf33 <+51>:    mov    rdi,rbx
   0x26bf36 <+54>:    call   0x26be90 <Module::InitializeDynamicILCrst()>
Remember, this is stored in the rdi register. This register is copied to rbx :
0x26bf10 <+16>: mov rbx,rdi
Then we reuse this register here:
   0x26bf27 <+39>:    mov    r14,QWORD PTR [rbx+0x568]
   0x26bf2e <+46>:    test   r14,r14
   0x26bf31 <+49>:    jne    0x26bf42 <Module::SetDynamicIL(unsigned int, unsigned long, int)+66>
This code reads the memory at the address rbx+0x568, pushes the contents to the r14 register, then tests something: test r14,r14. Testing a register against itself is the assembly way of checking if a value is empty. That’s our if (m_debuggerSpecificData.m_pDynamicILCrst == NULL) check! This means that m_debuggerSpecificData.m_pDynamicILCrst is located at the offset 0x568 from the address of the module instance.
That’s great, but I needed m_debuggerSpecificData.m_pDynamicILBlobTable, not m_debuggerSpecificData.m_pDynamicILCrst. So I had a look at the structure stored in the m_debuggerSpecificData field:
    struct DebuggerSpecificData
    {
        // Mutex protecting update access to the DynamicILBlobTable and TemporaryILBlobTable
        PTR_Crst                 m_pDynamicILCrst;

                                                // maps tokens for EnC/dynamics/reflection emit to their corresponding IL blobs
                                                // this map *always* overrides the Metadata RVA
        PTR_DynamicILBlobTable   m_pDynamicILBlobTable;

                                                // maps tokens for to their corresponding overriden IL blobs
                                                // this map conditionally overrides the Metadata RVA and the DynamicILBlobTable
        PTR_DynamicILBlobTable   m_pTemporaryILBlobTable;

        // hash table storing any profiler-provided instrumented IL offset mapping
        PTR_ILOffsetMappingTable m_pILOffsetMappingTable;

        // Strict count of # of methods in this module that are JMC-enabled.
        LONG    m_cTotalJMCFuncs;

        // The default JMC status for methods in this module.
        // Individual methods can be overridden.
        bool    m_fDefaultJMCStatus;
    };
Fields are stored in memory in the same order as they are declared in the code. So m_pDynamicILBlobTable is the pointer stored right after m_pDynamicILCrst in the memory.
To test this, I first needed the address of the module containing LoadBackendTypes. If you scroll all the way back to where I called dumpmd, you can find it in the output:
> dumpmd 00007FCF16509B58

Method Name:          Npgsql.PostgresDatabaseInfo+<LoadBackendTypes>d__16.MoveNext()
[...]
Module:               00007fcf13ec67d8
[...]
I was looking for the content of the memory at the offset 0x568 of the Module, so I added that to the Module address to get 0x7FCF13EC67D8 + 0x568 = 0x7FCF13EC6D40
I then used LLDB to dump the memory at that address:
(lldb) memory read --count 4 --size 8 --format x 7FCF13EC6D40

0x7fcf13ec6d40: 0x00007fce8c90c820 0x00007fce8c938380
0x7fcf13ec6d50: 0x0000000000000000 0x0000000000000000
Assuming my reasoning was correct, 0x00007fce8c90c820 would be the address of m_pDynamicILCrst, and 0x00007fce8c938380 the address of m_pDynamicILBlobTable. There was no way to be completely sure, but I could check if the values in memory matched the layout of the table in the source code:
    PTR_element_t m_table;                // pointer to table
    count_t       m_tableSize;            // allocated size of table
    count_t       m_tableCount;           // number of elements in table
    count_t       m_tableOccupied;        // number, includes deleted slots
    count_t       m_tableMax;             // maximum occupied count before reallocating
One pointer to a table, followed by 4 integers indicating the size and the occupancy of the table.
I first dumped the pointer:
(lldb) memory read --count 2 --size 8 --format x 0x00007fce8c938380

0x7fce8c938380: 0x00007fce8c938a90 0x000000010000000b
0x00007fce8c938a90 sure looks like a pointer to the heap. Then I checked the integers (using size 4 instead of size 8 ):
(lldb) memory read --count 8 --size 4 --format x 0x00007fce8c938380

0x7fce8c938380: 0x8c938a90 0x00007fce 0x0000000b 0x00000001
0x7fce8c938390: 0x00000001 0x00000008 0x00000045 0x00000000
The pointer was still there (looking backward because of endianness), then a few small values. I mapped everything to the fields of the table and got:
m_table         = 0x00007fce8c938a90
m_tableSize     = 0x0b
m_tableCount    = 0x1
m_tableOccupied = 0x1
m_tableMax      = 0x8
Once again, there was no way to be sure, but the values were consistent with the expected layout, and seemed to indicate that there was one element stored in the table!
m_table is a hashtable associating method tokens and pointers to IL code:
struct  DynamicILBlobEntry
{
    mdToken     m_methodToken;
    TADDR       m_il;
};
I must confess I had a bit of trouble figuring out the layout of the hashtable from the source code (full of templates and other C++ magic), so I cheated a bit. I knew from the dumpmd output that my method token was 0x6000D24. So I just dumped a bunch of memory at the memory location of the hashtable and looked for that value:
(lldb) memory read --count 32 --size 4 --format x 0x00007fce8c938a90
0x7fce8c938a90: 0x00000000 0x00007fce 0x00000000 0x00000000
0x7fce8c938aa0: 0x00000000 0x00007fcf 0x00000000 0x00000000
0x7fce8c938ab0: 0x00000000 0x6265645b 0x00000000 0x00000000
0x7fce8c938ac0: 0x00000000 0x6974616c 0x00000000 0x00000000
0x7fce8c938ad0: 0x00000000 0x74636e75 0x00000000 0x00000000
0x7fce8c938ae0: 0x00000000 0x36303437 0x00000000 0x00000000
0x7fce8c938af0: 0x06000d24 0x00000000 0x8c983790 0x00007fce
0x7fce8c938b00: 0x00000000 0x7367704e 0x00000000 0x00000000
It turned out that the value was next to a pointer (0x00007fce8c983790, backwards), so there was a good probability that it was pointing to the IL I was looking for!
How to confirm it? Every IL method has a header, so I decompiled the original PostgresDatabaseInfo.LoadBackendTypes method with dnSpy to look for a remarkable value. The LocalVarSig token had a value of 0x11000275:
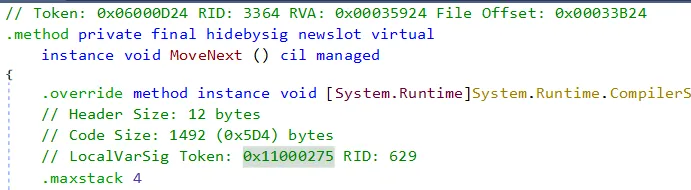
I then dumped a few bytes at the address I found and looked for the value:
(lldb) memory read --count 8 --size 4 --format x 0x00007fce8c983790

0x7fce8c983790: 0x0002301b 0x000005fe 0x11000275 0x08007b02
0x7fce8c9837a0: 0x020a0400 0x0008037b 0x19060b04 0x0d167936
And sure enough, it matched!
The next and final step was to dump the IL and try to understand why it was causing the InvalidProgramException. That will be the subject of the next article.