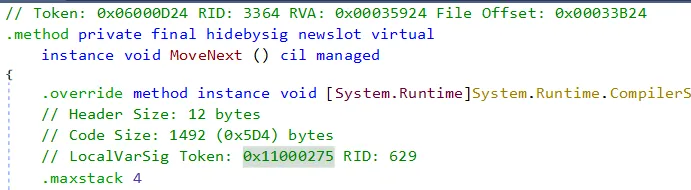
In this series of article, we’re retracing how I debugged an InvalidProgramException, caused by a bug in the Datadog profiler, from a memory dump sent by a customer. In this part, we extract the dynamic IL from the memory dump.
In this series of article, we’re retracing how I debugged an InvalidProgramException, caused by a bug in the Datadog profiler, from a memory dump sent by a customer. The first part of the investigation is an introduction to using a memory dump from a .NET application to find the information you seek.
Inspiration for quarantine days: how to connect a Raspberry Pi to a training bike to stream the speed to a computer and pause a video when below 20 km/h
Kevin Gosse has been using Microsoft .NET technologies for 20 years, across client, server, and mobile applications. Passionate about debugging and performance. He is Microsoft MVP and is currently employed at JetBrains, where he works on improving the performance of ReSharper. He is co-author of the book Pro .NET Memory Management 2nd edition (Apress).