In this series of article, we’re retracing how I debugged an InvalidProgramException, caused by a bug in the Datadog profiler, from a memory dump sent by a customer. In this part, we extract the dynamic IL from the memory dump.
In this series of article, we’re retracing how I debugged an InvalidProgramException, caused by a bug in the Datadog profiler, from a memory dump sent by a customer. The first part of the investigation is an introduction to using a memory dump from a .NET application to find the information you seek.
How to inspect arbitrary values in the memory of a .net process on Linux… And find an unexpected bug in the process.
Using debugging tools to get rid of a nagging popup.
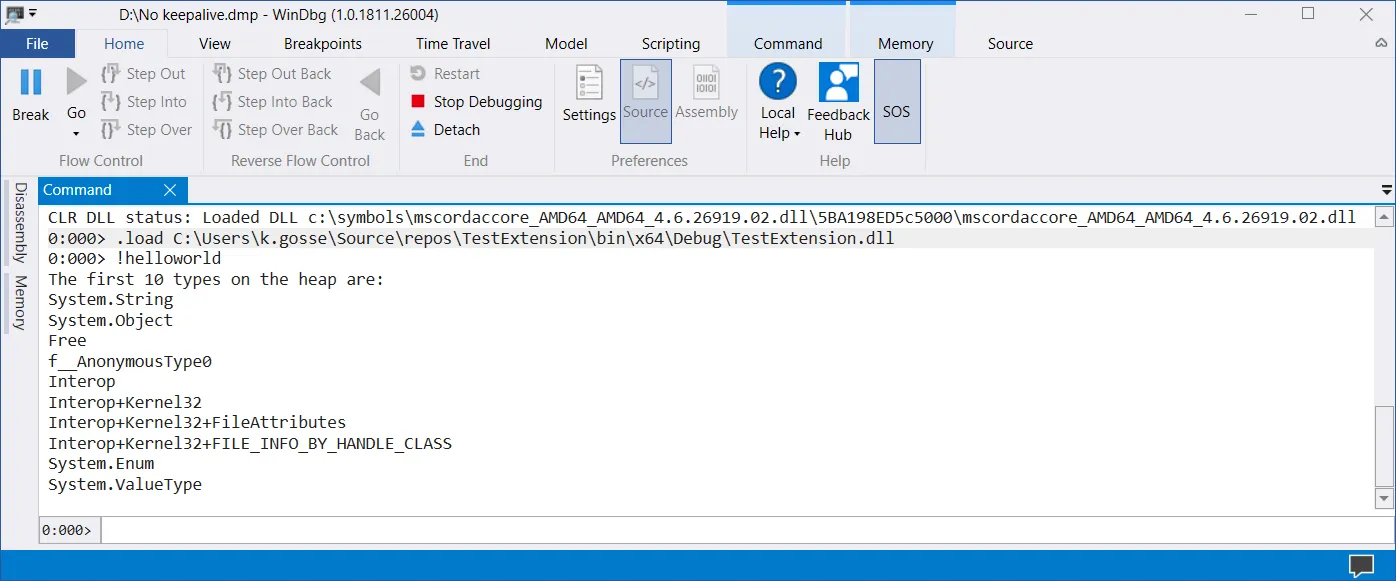
How to implement the WinDbg DumpStackObjects command in ClrMD.
Showing the mindset and methodology involved in the debugging of an application you know almost nothing about.
Guide on how to write debugger extensions that are compatible with both WinDbg and LLDB.